Mastering Exploratory Data Analysis
Introduction to EDA
Getting to Know Your Data
Before you build a house, you inspect the land. Before you cook a meal, you check your ingredients. And before you analyze data, you explore it. This initial, crucial step is called Exploratory Data Analysis, or EDA.
EDA is the process of using simple tools and visualizations to summarize, understand, and question a dataset before you start building complex models.
Think of it as a conversation with your data. You're not trying to prove a point or find a definitive answer just yet. Instead, you're asking questions: What's in here? Are there any surprises? What stories might this data tell? This process helps you spot errors, discover patterns, and get a feel for the data's structure and limitations.
Exploratory Data Analysis (EDA) is used by data scientists to examine and visualize data to understand its main characteristics, identify patterns, spot anomalies, and test hypotheses.
An Idea from the 70s
The idea of EDA was formalized by American mathematician John Tukey in the 1970s. Before Tukey, data analysis was often a very rigid process. You would start with a hypothesis, collect data to test it, and then run statistical tests to see if your hypothesis was correct. This is known as confirmatory data analysis.
Tukey argued for a different approach. He believed analysts should be more like detectives, looking for clues in the data before deciding what to investigate further. EDA is about generating hypotheses, not just testing them. It’s a more flexible, open-minded way to begin your analysis.
Why EDA is Essential
Skipping EDA is like setting off on a road trip without looking at a map. You might get to your destination, but you'll probably take a few wrong turns and miss some interesting sights. In data science, EDA is a critical part of the workflow for several reasons:
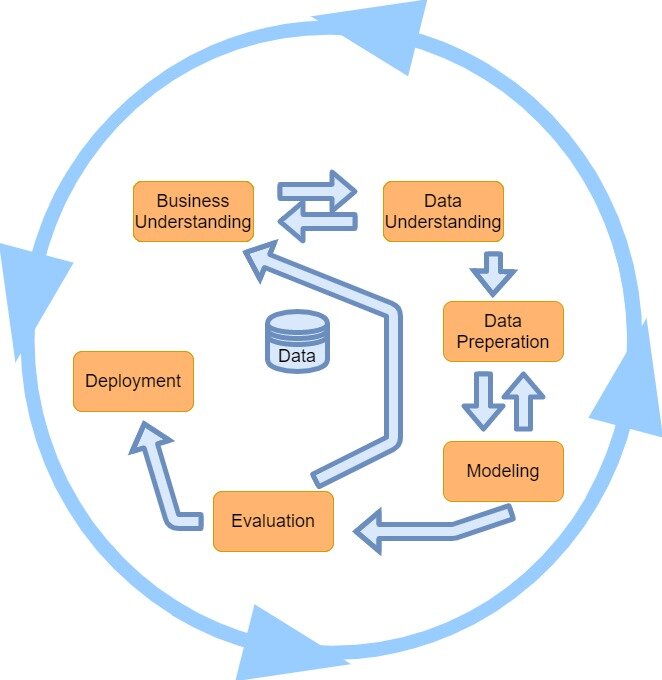
First, it helps you clean your data. You can spot obvious errors, like a temperature reading of -1000 degrees, or find missing values that need to be addressed. A model built on bad data will produce bad results.
Second, it helps you understand your variables. You'll see the range of values for each feature, how they're distributed, and what type of data they are (e.g., numbers, text, categories). This understanding is crucial for the next steps.
Finally, EDA is where you uncover initial insights. You might find surprising relationships between variables or identify distinct groups within your data. These discoveries guide your modeling strategy and ensure you're asking the right questions.
The EDA Toolkit
EDA uses a variety of techniques, which generally fall into two categories: summarizing data with numbers and visualizing it with charts.
| Technique Category | Common Methods |
|---|---|
| Summary Statistics | Calculating basic numbers like mean, median, and standard deviation to get a quick sense of the data's central tendency and spread. |
| Data Visualization | Creating charts and plots like histograms (to see distributions), scatter plots (to see relationships), and box plots (to spot outliers). |
These aren't complex, final analyses. They are quick, informative checks that help you build intuition about the dataset. The goal is to rapidly iterate and ask new questions as you learn more.
Time to check what you've learned about the fundamentals of EDA.
What is the primary goal of Exploratory Data Analysis (EDA)?
The mathematician credited with formalizing the concept of EDA in the 1970s is ______.