Mastering ECG Interpretation
ECG Basics
The Heart’s Spark
Your heart isn't just a muscle; it's an electrical pump. Each beat is driven by a tiny, perfectly timed electrical impulse. This current originates in a specialized group of cells called the sinoatrial (SA) node, often called the heart's natural pacemaker. It's located in the upper right chamber, or atrium.
From the SA node, the signal spreads across both atria, causing them to contract and push blood into the lower chambers, the ventricles. The signal then pauses briefly at the atrioventricular (AV) node, allowing the ventricles to fill completely.
Next, the impulse travels down the Bundle of His, which splits into right and left bundle branches. These pathways carry the signal to the bottom of the heart, where it spreads rapidly through the Purkinje fibers embedded in the ventricle walls. This triggers a powerful, coordinated contraction of the ventricles, pumping blood out to the lungs and the rest of the body.
Capturing the Current
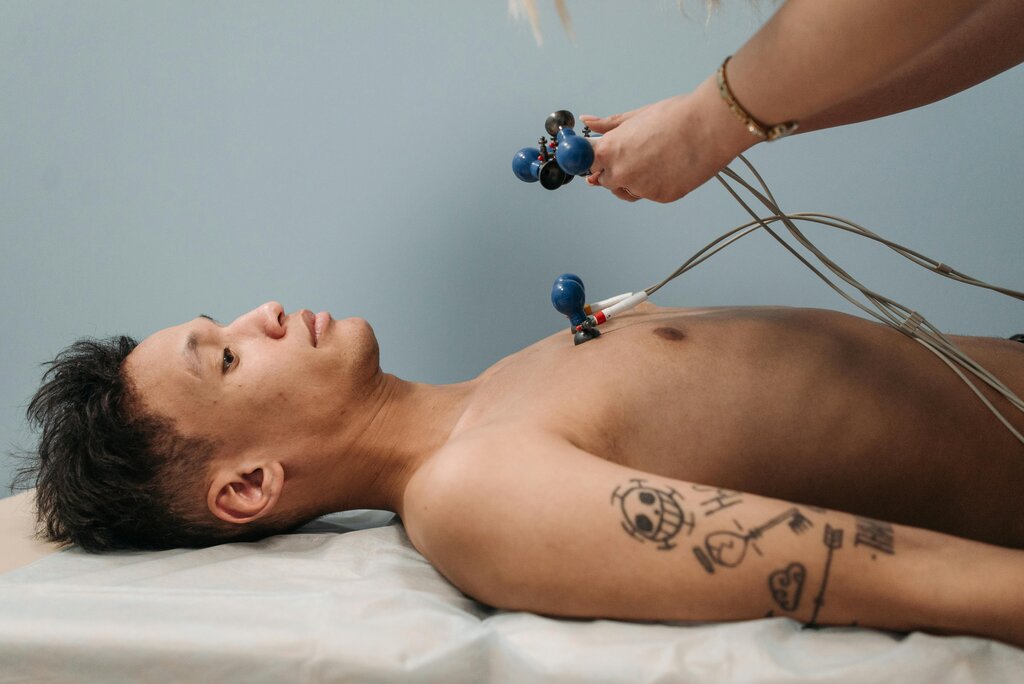
An electrocardiogram, or ECG, is a simple, non-invasive test that records this electrical activity. By placing small sensors called electrodes on the skin, an ECG machine can detect the tiny electrical changes that occur with each heartbeat. It then translates this information into a graph, allowing doctors to see the heart's electrical rhythm in real-time.
The main purpose of an ECG is to check the health of the heart's electrical system. It can help identify irregular heartbeats (arrhythmias), find the cause of chest pain, see if the heart is getting enough oxygen, and check the overall health of the heart muscle.
Decoding the Waves
A standard ECG tracing shows a repeating pattern of waves, complexes, and intervals. Each part of this pattern corresponds to a specific electrical event in the heart.
The main components are:
- P wave: The first small, upward bump. It represents atrial depolarization, which is the electrical activation of the atria that leads to their contraction.
- QRS complex: This is the largest part of the tracing, consisting of a small downward deflection (Q wave), a tall upward spike (R wave), and another downward deflection (S wave). It represents ventricular depolarization, the powerful electrical jolt that causes the ventricles to contract.
- T wave: The modest upward bump that follows the QRS complex. It represents ventricular repolarization, which is the electrical recovery or resetting of the ventricles as they prepare for the next beat.
| Wave | Represents | Mechanical Event |
|---|---|---|
| P wave | Atrial depolarization | Atrial contraction |
| QRS complex | Ventricular depolarization | Ventricular contraction |
| T wave | Ventricular repolarization | Ventricular relaxation |
A 12-Angle View
To get a complete picture of the heart's electrical activity, a standard ECG uses 12 leads. This doesn't mean 12 wires are attached to the body. Instead, it refers to 12 different electrical viewpoints of the heart, created by signals from 10 electrodes.
These electrodes are placed in standard locations: one on each arm and leg, and six across the chest. The chest leads, also known as precordial leads, are placed in very specific spots to provide a detailed view of the heart's horizontal plane.
The combination of the limb leads and chest leads allows a cardiologist to view the heart's electrical activity from three different planes: frontal, horizontal, and sagittal. This multi-angle perspective is crucial for pinpointing the location of any electrical problems within the heart.
Understanding these fundamentals is the first step in learning how to read an ECG. By recognizing the normal patterns and knowing what they represent, you build the foundation for identifying abnormalities.
What is the common name for the sinoatrial (SA) node, which initiates the electrical impulse for each heartbeat?
On an ECG tracing, which component represents the powerful electrical activation of the ventricles?