Mastering EazyBI for Data Insights
Introduction to eazyBI
Go Beyond Default Reports
Atlassian tools like Jira and Confluence are powerful for managing projects, but their built-in reporting features can sometimes feel limited. When you need to dig deeper, analyze trends across projects, or visualize data in a specific way, you need something more flexible. This is where eazyBI comes in.
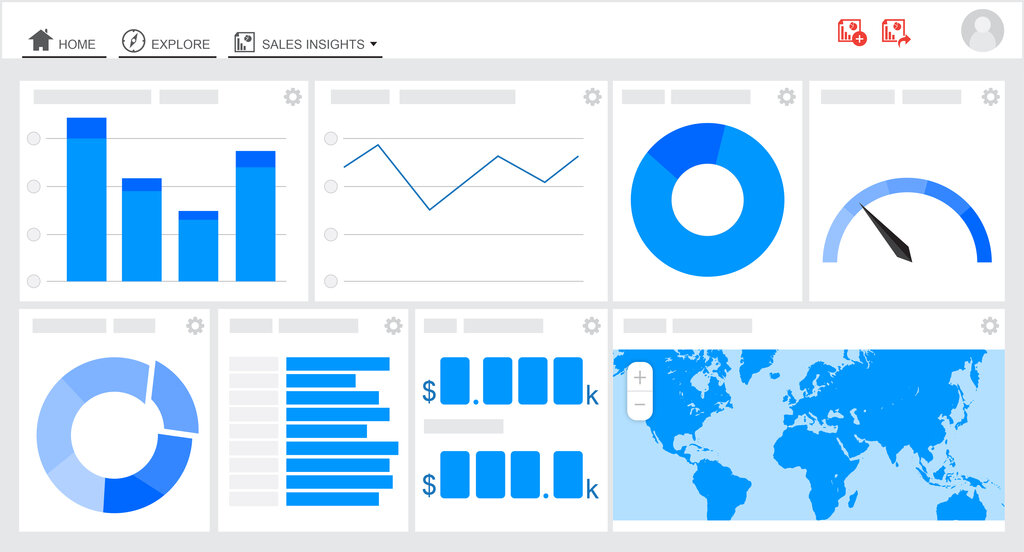
eazyBI is a business intelligence (BI) and reporting app that plugs directly into your Atlassian ecosystem. It allows you to pull data from Jira and Confluence to build custom reports, interactive charts, and detailed dashboards. Instead of being stuck with predefined metrics, you can explore your project data freely to find the answers you need.
How It Works
The core strength of eazyBI lies in its user-friendly approach to data analysis. You don't need to be a data scientist to get valuable insights.
One of its standout features is the drag-and-drop report builder. You can select different data points, like issue status, assignee, or sprint, and drag them into rows and columns to create a report. This makes it simple to pivot your data and look at it from different angles. eazyBI supports all of Jira’s standard fields and, crucially, any custom fields you’ve created to fit your team’s workflow.
Build complex reports and charts without writing a single line of code.
While its integration with Jira and Confluence is seamless, eazyBI isn't limited to the Atlassian world. You can also import data from external sources. This means you can combine your project management data with financial data from a SQL database or sales numbers from a CSV file. By merging these different datasets, you can create a comprehensive view of your business performance all in one place.
Making Data-Driven Decisions
The ultimate goal of using a tool like eazyBI is to make better, more informed decisions. When data is presented clearly and visually, patterns and insights emerge that might otherwise be hidden in spreadsheets or basic reports.
For project teams, this means you can easily track progress against goals, identify bottlenecks in your workflow, and monitor team workload. For example, you could create a chart showing the average time issues spend in each status, helping you spot where work gets stuck. Or you could build a dashboard that tracks key performance indicators (KPIs) for a new product launch, giving stakeholders a real-time view of its success.
By turning raw data into actionable insights, eazyBI empowers teams to move beyond guesswork and base their strategies on hard evidence.
Now, let's review what you've learned about eazyBI.
What is the primary function of eazyBI in the Atlassian ecosystem?
Which feature is highlighted as a core part of eazyBI's user-friendly approach to data analysis?
With its powerful customization and integration features, eazyBI helps teams unlock the full potential of their project data.