Mastering Dimensionality with PCA
Linear Algebra Foundations
From Words to Vectors
You're familiar with representing text using models like Bag of Words, where each unique word in a vocabulary becomes a dimension. A document is then plotted as a point in this high-dimensional space, with coordinates equal to the frequency of each word. For instance, in a simple vocabulary of ('cat', 'dog', 'fish'), the sentence "The cat chased the dog" becomes the vector . This transforms language into geometry.
Each document is a vector, an arrow starting from the origin and pointing to its coordinates. The collection of all possible document vectors forms a vector space. This geometric view is powerful. It lets us use the tools of linear algebra to measure similarities, find patterns, and, most importantly for us, reduce complexity.
Finding Structure with Covariance
In a high-dimensional word space, some words frequently appear together while others don't. The words 'machine' and 'learning' likely coexist more often than 'machine' and 'avocado'. This co-occurrence is a form of structure. We can measure this relationship using a covariance matrix — a compact way to summarise how every dimension (word) in our dataset varies with every other dimension.
Covariance
noun
A measure of the joint variability of two random variables. A positive value means they tend to increase or decrease together, while a negative value means one tends to increase as the other decreases.
Let's calculate one. Imagine we have three short documents and we're tracking the counts of two words: 'AI' and 'data'.
- Doc 1: (AI=1, data=2)
- Doc 2: (AI=2, data=4)
- Doc 3: (AI=3, data=6)
First, we find the average count for each word: and .
The covariance matrix, , for two variables and is structured like this:
Using the formula and :
| Calculation | Value |
|---|---|
| Variance of AI | |
| Variance of data | |
| Covariance(AI, data) |
So, our covariance matrix is:
The positive covariance of 2 tells us that, in our tiny dataset, the counts of 'AI' and 'data' tend to rise together. The diagonal values (1 and 4) show that 'data' has a larger spread, or variance, than 'AI'. PCA will use this matrix to find the directions of maximum variance in the data.
Changing Our Point of View
Our original vector space used a standard basis. Think of a basis as the fundamental set of directions used to define the space. In a 2D plot, the standard basis vectors are usually and , which point along the x-axis and y-axis. Any vector can be described as a combination of these basis vectors. The vector is simply .
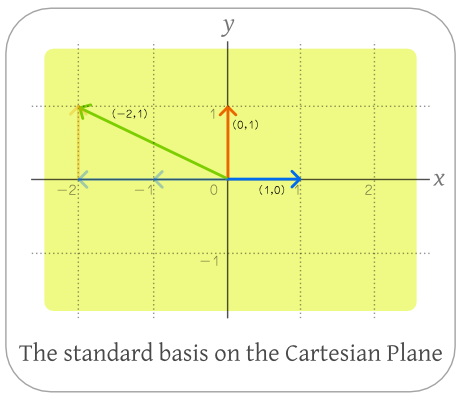
But what if the x and y axes aren't the most natural way to describe our data? If our word counts form a slanted cloud of points, the standard axes might not capture the main direction of the data's spread. PCA's goal is to find a new basis — a new set of axes — that aligns perfectly with the data's variance. This is called a change of basis.
The new axes are the principal components. The first principal component is the direction of maximum variance. The second is the next most important direction, perpendicular to the first. By transforming our data onto this new basis, we can often describe most of the information using just the first few components, effectively reducing the number of dimensions.
The entire process is a matrix transformation of our data from the original basis to the new one defined by the principal components. By projecting the original data onto these new axes, we get a new, more efficient representation.
PCA uses linear algebra to transform data into new features called principal components.
This geometric foundation — representing data as vectors, measuring relationships with covariance, and changing basis to find the most informative view — is the engine that drives PCA. It turns a complex, high-dimensional problem into a more manageable one by finding the directions that matter most.
Using the Bag of Words model and a vocabulary of ('cat', 'dog', 'fish'), how would the sentence "A dog saw a fish" be represented as a vector?
What does a positive covariance value between the counts of two words (e.g., 'machine' and 'learning') in a dataset indicate?