Mastering Data Analysis Techniques
Intermediate Statistical Concepts
Beyond Averages
When we look at data, we're often looking for patterns. Beyond simple averages, we want to understand the shape and spread of our information. This is where probability distributions come in. A probability distribution is a map that shows us all the possible outcomes of an event and how likely each one is.
Think about the heights of adults. Most people cluster around an average height, with fewer individuals being exceptionally tall or short. If we were to plot this, it would form a familiar shape.
Normal Distribution
noun
A common probability distribution that is symmetric about the mean, showing that data near the mean are more frequent in occurrence than data far from the mean. It's also known as the bell curve.
The normal distribution is just one of many types. Others, like the binomial or Poisson distribution, are used to model different kinds of data, such as the number of heads in 10 coin flips or the number of emails you receive in an hour. Choosing the right distribution is key to understanding the data's story.
Testing Your Ideas
Once we understand the shape of our data, we can start asking questions. Let's say a company claims its new battery lasts for 10 hours on average. You test a sample of batteries and find the average is 9.5 hours. Is the company's claim wrong, or was your sample just a bit unlucky? Hypothesis testing provides a structured way to answer this.
We start with two competing statements:
- Null Hypothesis (): This is the default assumption, the status quo. In our example, is that the average battery life is 10 hours.
- Alternative Hypothesis ( or ): This is what we want to test. Here, might be that the average battery life is less than 10 hours.
The goal isn't to prove the alternative hypothesis, but to see if we have enough evidence to reject the null hypothesis.
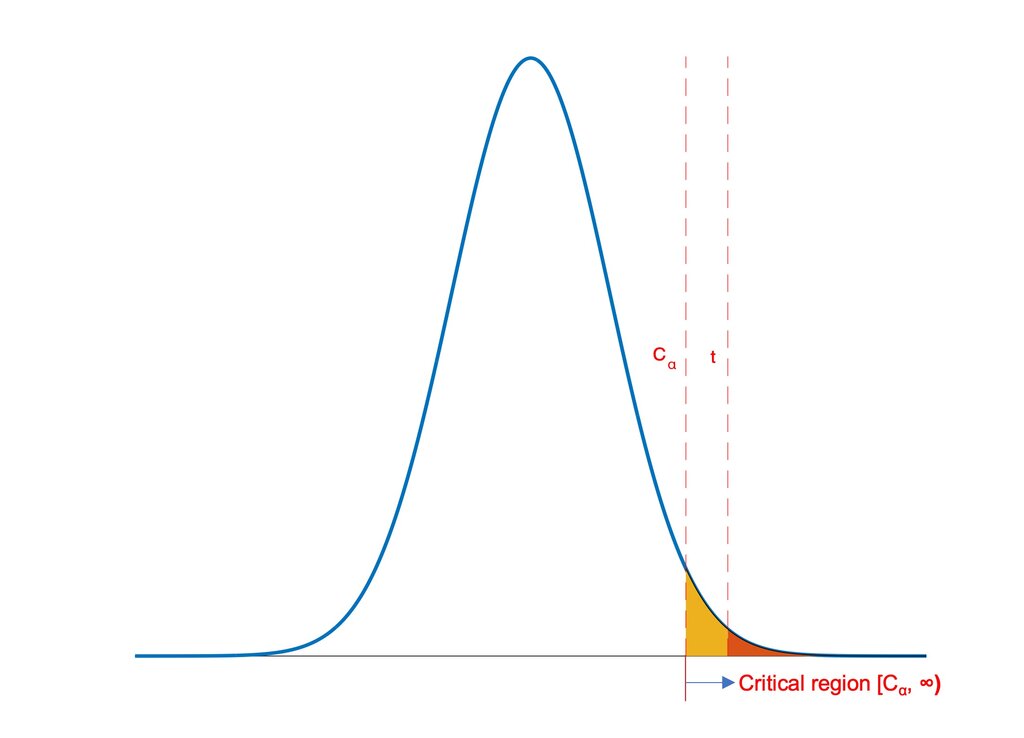
We analyze our sample data to calculate a p-value. The p-value is the probability of observing our data (or something more extreme) if the null hypothesis were true. A small p-value suggests our result is surprising under the null hypothesis. If the p-value is smaller than our chosen significance level (often 0.05), we reject the null hypothesis in favor of the alternative.
Ranges of Plausibility
While hypothesis testing gives a yes-or-no answer about a specific value, sometimes we want a range of plausible values. If our sample of batteries had an average life of 9.5 hours, we know the true average for all batteries is probably not exactly 9.5 hours. A confidence interval gives us a range where we think the true average lies.
For example, we might calculate a 95% confidence interval and find it's [9.2 hours, 9.8 hours]. This means we are 95% confident that the true average battery life for the entire population of batteries falls within this range. Since 10 hours is outside this interval, it gives us another reason to be skeptical of the company's claim.
A confidence interval provides a point estimate (like 9.5 hours) plus or minus a margin of error. A wider interval means more uncertainty; a narrower one means more precision.
Finding Relationships
Often, we want to know how different variables relate to each other. Does more advertising lead to more sales? Does studying more lead to higher test scores? Regression analysis is a powerful tool for modeling the relationship between a dependent variable (the outcome we care about) and one or more independent variables (the factors we think have an influence).
The simplest form is linear regression, which tries to fit a straight line to the data. The equation for this line is:
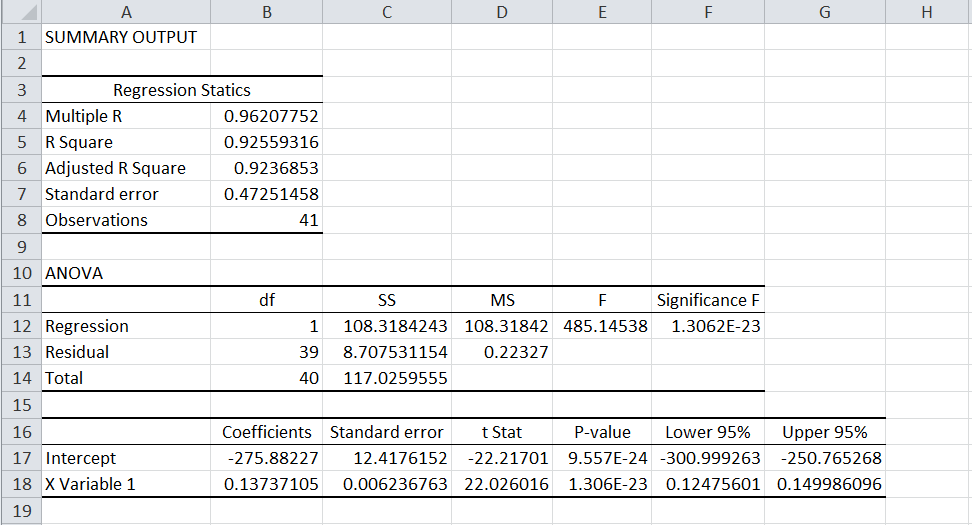
By finding the best values for and , we can quantify the relationship. For instance, we might find that for every extra $1,000 spent on ads, sales increase by an average of $5,000. Regression analysis not only helps us understand these relationships but also allows us to make predictions.
Let's check your understanding of these core concepts.
Which of the following scenarios would be best modeled by a Poisson distribution?
In hypothesis testing, what does a small p-value (e.g., less than 0.05) indicate?