Mastering Dashboards
Introduction to Dashboards
What Is a Dashboard?
Think about the dashboard in your car. In a single glance, it tells you crucial information: your speed, how much fuel you have, and if your engine is running too hot. You don't need to read a manual or comb through raw data from the car's computer. You just look, understand, and act—maybe by slowing down or finding a gas station.
A data dashboard does the same thing, but for a business, a project, or a specific department. It’s a visual display of the most important information needed to achieve one or more objectives, consolidated and arranged on a single screen so the information can be monitored at a glance.
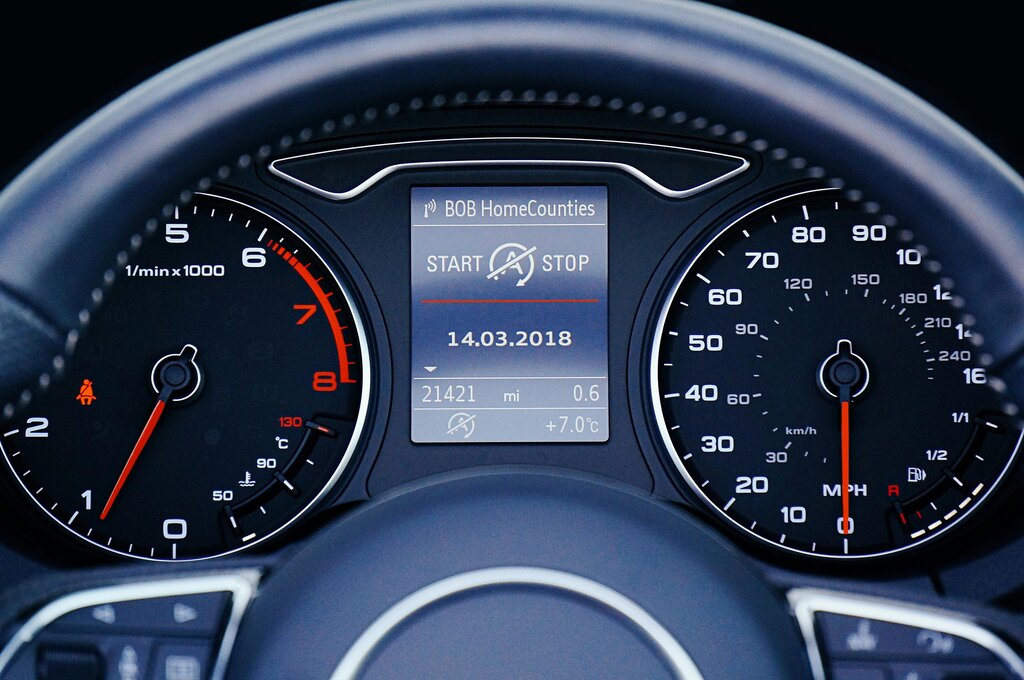
Instead of speed and fuel, a business dashboard tracks metrics like sales revenue, website traffic, or customer satisfaction. These core metrics are often called Key Performance Indicators, or KPIs.
Key Performance Indicator (KPI)
noun
A measurable value that demonstrates how effectively a company is achieving key business objectives.
The main goal is to turn large sets of data into actionable insights. Dashboards make complex information easy to understand, helping people make smarter, faster decisions without getting lost in spreadsheets.
Dashboards for Different Goals
Not all dashboards are created equal. The design and the data it displays depend entirely on its purpose and who is using it. A CEO needs a different view of the company than a customer service agent does. Generally, dashboards fall into three categories.
| Type | Purpose | Audience | Data Focus |
|---|---|---|---|
| Operational | Monitor real-time activity | Front-line staff, team leads | Live, constantly updated data |
| Strategic | Track long-term goals | Executives, managers | High-level trends, summaries |
| Analytical | Explore data for insights | Data analysts | Large, complex datasets |
Operational dashboards are about what’s happening right now. They help teams monitor day-to-day operations and quickly respond to issues. For example, a factory floor manager might use an operational dashboard to track production line output per hour. The data is updated in real time or very frequently.
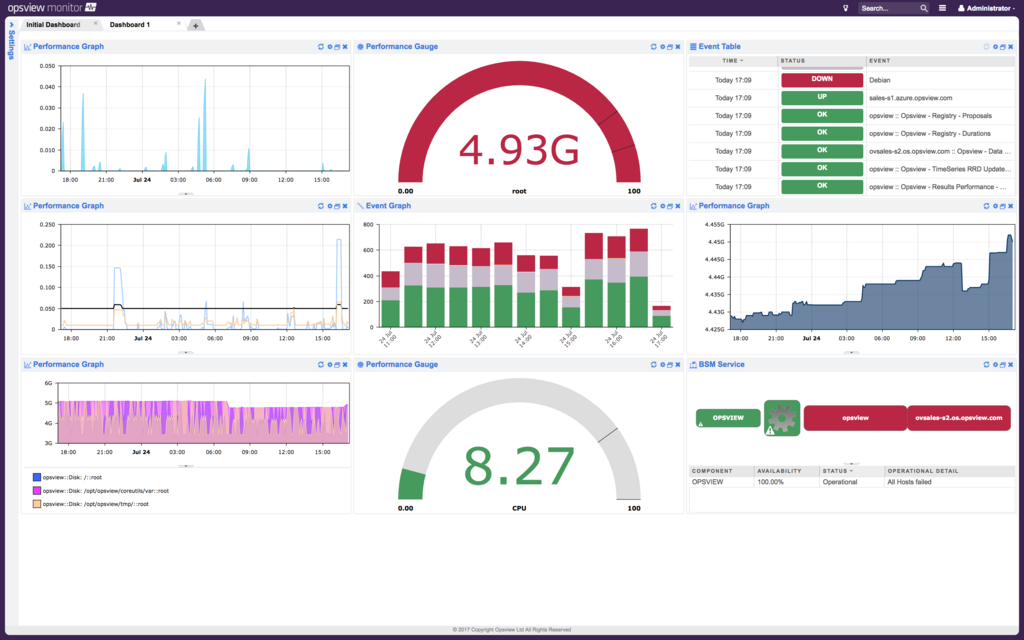
Strategic dashboards focus on the big picture and long-term goals. Executives and managers use them to track progress on key performance indicators (KPIs) over weeks, months, or years. These dashboards summarize performance and are less about immediate action and more about strategic adjustments. A marketing director might use one to see quarterly growth in market share.
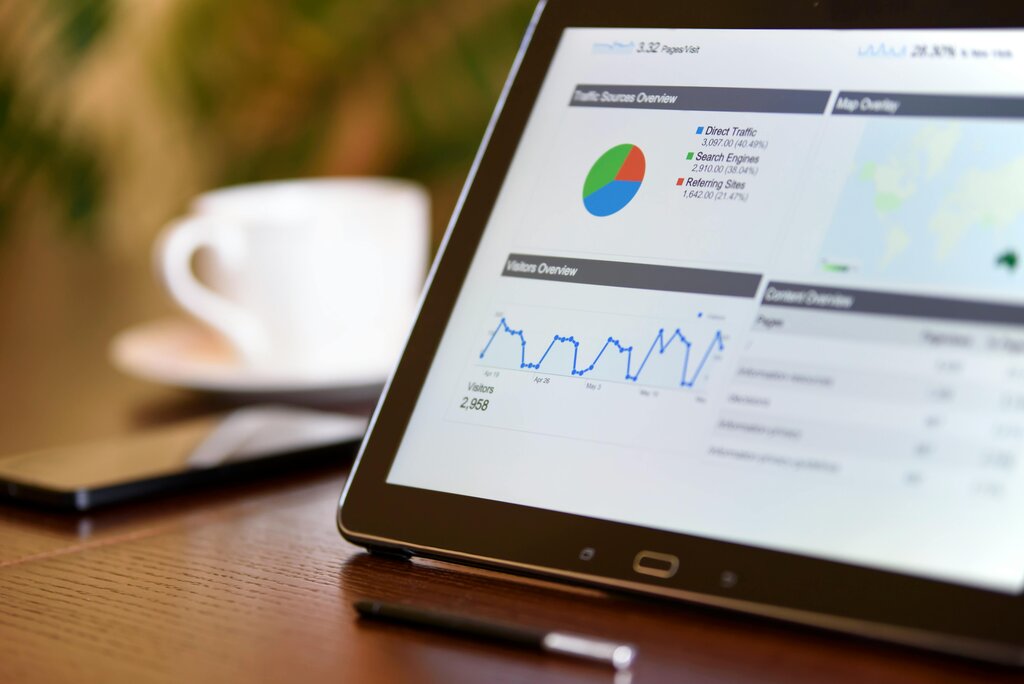
Analytical dashboards are for deep dives into data. Used by data analysts, they provide a large amount of information and allow users to explore it from different angles. These dashboards are less about monitoring and more about discovery. An analyst might use one to figure out why sales in a particular region have declined by looking at multiple variables.
Why Use Dashboards?
Dashboards are powerful because they make data accessible to everyone, not just data experts. By presenting information visually, they help people spot trends, patterns, and problems that might be hidden in raw numbers. This leads to better, more informed decision-making across an entire organization.
They also create transparency and alignment. When everyone can see the same performance metrics, teams can work together more effectively toward shared goals. It turns abstract objectives into concrete, trackable numbers.
A good dashboard tells a story.
Now that you understand what dashboards are and why they're useful, let's test your knowledge.
What is the primary purpose of a data dashboard?
A CEO wants to track the company's progress towards its annual revenue and market share goals. Which type of dashboard would be most suitable for this purpose?
In short, dashboards translate data into insight, helping teams monitor performance, track goals, and make decisions with confidence.