Mastering Common Math Functions
Graphing Lines
From Equation to Picture
An equation like is really a rule that connects an input, , to an output, . But what if you wanted to see all the possible answers at once? That's where a graph comes in. It's a visual map of every single pair that makes the equation true.
To create this map, we use the , which is just a fancy name for two number lines that cross at a right angle. The horizontal line is the x-axis (for your inputs), and the vertical line is the y-axis (for your outputs). Their crossing point is called the origin, where both and are zero.
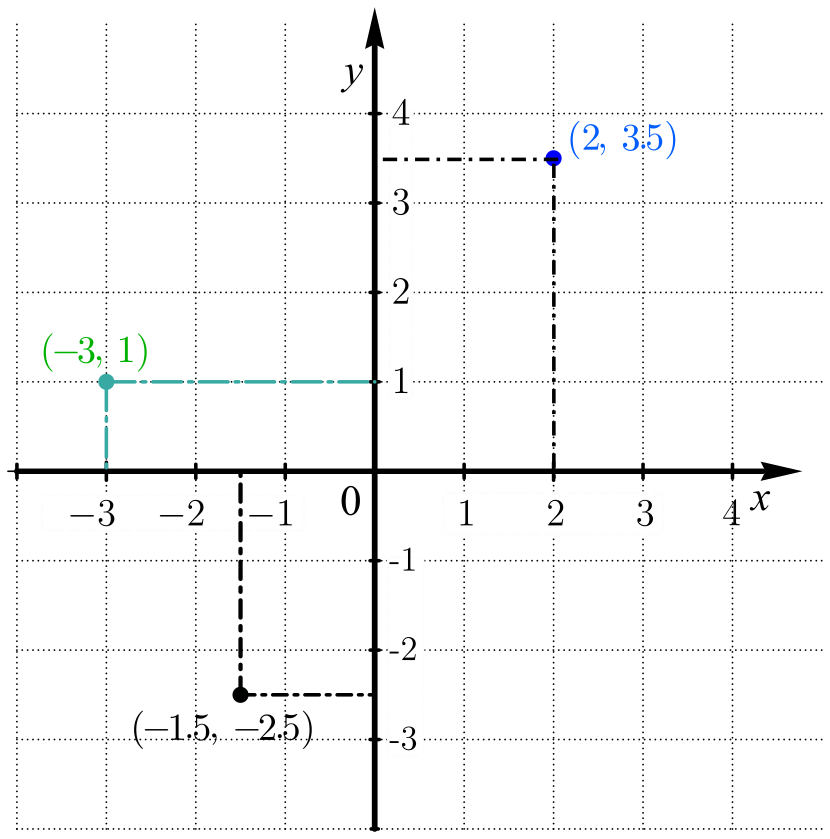
Every point on this grid can be described by an "ordered pair" of numbers, written as . The first number tells you how far to move along the x-axis (left or right), and the second number tells you how far to move along the y-axis (up or down). A point at means you go 2 units to the right and 3 units up from the origin.
Plotting a Line Step by Step
Let's turn an equation into a line. We'll use . The easiest place to start is with the y-intercept, which is the 'b' value. In our equation, . This is the point where the line crosses the y-axis. At every point on the y-axis, the x-value is 0. So, our starting point is .
Now we need a second point to draw our line. This is where the slope, 'm', comes in. Our slope is 2. Slope is often described as , which tells you how to move from one point to the next.
Starting from our y-intercept at :
- Rise by 2: Move 2 units straight up.
- Run by 1: Move 1 unit to the right.
This brings us to a new point. The original y-value was 1, and we added 2, giving us 3. The original x-value was 0, and we added 1, giving us 1. Our second point is . Now just draw a straight line through your two points.
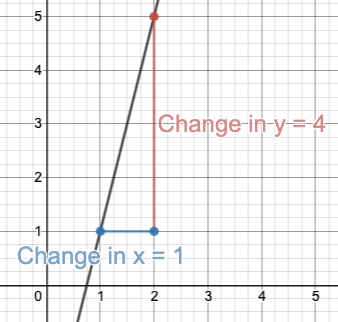
You only need two points to define a line, but you can repeat the process as many times as you like. From , you could rise 2 and run 1 again to find the point , which also lies on the same line.
Understanding Steepness
The slope, , tells you a story about the line. The bigger the absolute value of the slope, the steeper the line.
-
A line with a slope of 5 is much steeper than a line with a slope of . The first line climbs 5 units for every 1 unit it runs horizontally. The second only climbs half a unit.
-
A positive slope means the line goes up as you move from left to right.
-
A negative slope means the line goes down. A slope of means you would "rise" by (go down 2 units) for every 1 unit you run to the right.
A horizontal line has a slope of 0 (no rise). A vertical line has an undefined slope (no run, which would mean dividing by zero).
Being able to sketch a line from its equation is like being able to visualize a small program's output just by reading the code. It gives you an immediate, intuitive sense of how the variables and relate to each other.
What is the primary purpose of graphing an equation like ?
In the Cartesian coordinate system, the point where the x-axis and y-axis intersect is called the __________.