Mastering Business Analytics for Decision Making
Strategic Analytics Framework
From Data to Decisions
Having data isn't the same as using it well. The real value of analytics comes from an organisation's ability to turn information into strategic action. This journey is often described by the Analytics Maturity Model, which charts a course from simply reporting on the past to shaping the future.
Most organisations start with descriptive analytics, which uses historical data to generate reports and dashboards showing what happened. The next step is diagnostic analytics, which digs deeper to understand why something happened. This involves identifying patterns and root causes.
Moving higher up the model, predictive analytics uses statistical models and machine learning to forecast future outcomes. The ultimate goal is prescriptive analytics, which not only predicts what will happen but also recommends actions to achieve a desired outcome. Advancing through these stages requires a deliberate strategy that aligns analytical efforts with business goals.
Asking the Right Questions
A powerful analysis of the wrong problem is useless. The starting point for any analytics project is to frame the business challenge as a clear, answerable question. This process involves translating vague business needs into specific, measurable queries that data can actually address.
Every analytics exercise must start with a sharply defined business problem based on specific use cases and business key performance indicators (KPIs).
One of the most effective tools for this is the SMART framework. It provides a simple checklist to ensure your analytical questions are well-defined and actionable.
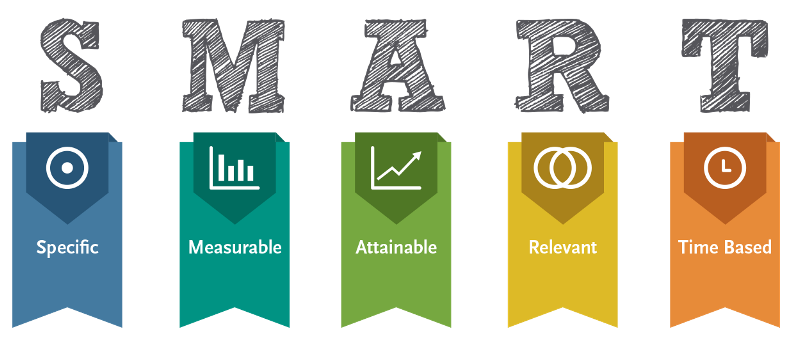
Let's apply this. A vague goal like "improve customer retention" becomes a SMART question: "Can we reduce customer churn among our top 10% of spenders by 5% in the next quarter by offering a personalised loyalty discount?"
This level of clarity is achieved through effective stakeholder requirement gathering. This means talking to the people who will use the analysis, whether they're in marketing, finance, or operations. You must understand their goals, the decisions they need to make, and what information would actually help them. Without this step, you risk delivering an analysis that is technically correct but practically irrelevant.
Prioritising for Impact
Organisations have endless questions they could ask of their data, but limited resources to answer them. Time, budget, and analyst availability are finite. This means you have to make smart choices about which analytics projects to pursue. It's a constant negotiation between speed, accuracy, and cost.
The Business Value Matrix is a simple but powerful tool for prioritising projects. It plots initiatives on two axes: their potential business impact and the feasibility of completing them. This helps teams focus their efforts where they will matter most.
Projects in the 'Quick Wins' quadrant are the obvious place to start. They deliver significant value with relatively low effort, building momentum and demonstrating the power of analytics to the rest of the organisation. 'Major Projects' require careful planning and resources but promise substantial returns. 'Fill-ins' can be done when time allows, while 'Thankless Tasks' should generally be avoided.
Measuring What Matters
Once a project is underway, you need a way to measure success. This is where Key Performance Indicators (KPIs) come in. A KPI is a measurable value that demonstrates how effectively a company is achieving key business objectives. Choosing the right KPIs is critical; the wrong ones can lead you to optimise for behaviour that doesn't actually help the business.
For example, if a company's objective is to improve customer support, tracking the number of support tickets closed per day might seem like a good KPI. However, this could encourage agents to rush through calls without resolving the underlying issues. A better KPI might be 'Customer Satisfaction Score' or 'First Contact Resolution Rate', as these are more directly aligned with the strategic goal of happy customers.
Good KPIs tell a story about your progress towards a goal. Bad KPIs, often called 'vanity metrics', make you feel good but don't inform your strategy. An example is tracking total website visits instead of the conversion rate of those visits.
By moving up the analytics maturity model, framing problems effectively, prioritising work with a value matrix, and selecting aligned KPIs, organisations can build a powerful strategic analytics framework. This transforms data from a simple asset into a core driver of intelligent decision-making.
Let's review the core concepts we've covered.
Now, check your understanding of how to apply these frameworks.
An e-commerce company is using historical sales data to forecast which products are likely to be top sellers during the upcoming holiday season. According to the Analytics Maturity Model, what type of analytics is being performed?
Which of the following business questions is the best example of one framed using the SMART framework?
With these frameworks, you're now equipped to think strategically about how to apply analytics to solve real-world business challenges.