Mastering Bollinger Bands
Introduction to Technical Analysis
What is Technical Analysis?
Technical analysis is a way of forecasting the future direction of prices by studying past market data, primarily price and volume. Instead of digging into a company's financial statements or management team, technical analysts look at charts. They believe that all the important information about an asset is already reflected in its price.
The core idea is that price movements aren't random. They often follow patterns and trends that can be identified and used to make trading decisions. Think of it as reading the market's collective psychology. The charts show the ongoing battle between buyers (bulls) and sellers (bears), and technical analysis provides the tools to interpret that struggle.
Technical analysis is about reading the market's psychology, not the company's balance sheet.
Reading the Charts
The price chart is the technical analyst's most important tool. It's a visual representation of an asset's price over time. There are several ways to display this information, but three types are the most common.
The simplest is the line chart. It's created by connecting a series of closing prices over a set time frame. It’s great for getting a quick, clean look at the general direction of the price, but it leaves out a lot of detail about what happened during each trading period.
For more detail, traders use bar charts. Each bar represents one period of time (like a day or an hour) and shows four key prices: the opening price, the highest price, the lowest price, and the closing price (OHLC). A vertical line shows the range between the high and low, while small horizontal ticks show the open (on the left) and close (on the right).
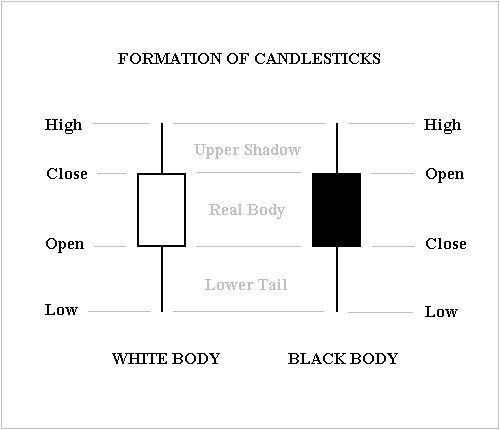
Most popular of all are candlestick charts. Like bar charts, they show the OHLC prices, but in a way that's easier to read at a glance. The wide part of the candlestick is called the 'real body,' which shows the range between the open and close price.
Typically, if the body is green or white, the close was higher than the open (a positive period). If it's red or black, the close was lower than the open (a negative period). The thin lines above and below the body are the 'wicks' or 'shadows,' and they show the high and low prices for the period. The patterns these candles form can give clues about future market direction.
Finding the Trend
One of the most fundamental concepts in technical analysis is the trend. Prices don't move in straight lines; they move in a series of zigs and zags. A trend is simply the general direction of these movements.
There are three types of trends:
- Uptrend: Characterized by a series of 'higher highs' and 'higher lows.' Each peak and trough is higher than the ones that came before it.
- Downtrend: The opposite of an uptrend, marked by a series of 'lower highs' and 'lower lows.'
- Sideways Trend (or Range): Occurs when the price moves back and forth between a relatively stable high and low point, without a clear overall direction.
Support and Resistance
As prices move in trends, they often seem to bounce off invisible floors and ceilings. These levels are called support and resistance, and they are key concepts in technical analysis.
Support is a price level where a downtrend can be expected to pause due to a concentration of demand. As the price drops towards support, it becomes cheaper, and buyers are more inclined to buy. This increased buying interest 'supports' the price and stops it from falling further.
Resistance is the opposite of support. It's a price level where an uptrend can be expected to pause or reverse due to a concentration of supply. As the price rises towards resistance, sellers become more inclined to sell, and the selling pressure 'resists' the price from rising higher.
Think of support as a floor and resistance as a ceiling. An old support level can become a new resistance level if the price breaks through it, and vice versa.
Finally, beyond chart patterns, analysts use technical indicators. These are mathematical calculations based on price, volume, or open interest of a security. They are used to forecast future price changes.
There are hundreds of indicators, but they generally fall into two categories: those that help identify the direction of a trend (like moving averages) and those that help identify the condition of the market, such as whether it's 'overbought' or 'oversold' (like the Relative Strength Index or RSI). We won't dive into specific indicators here, but they are powerful tools that build on the foundational concepts of charts, trends, and support/resistance.
Indicators help identify trends and generate trading signals.
Now, let's test your understanding of these core concepts.
What is the core assumption of technical analysis?
Which chart type displays the open, high, low, and close prices for a period in a format that is often considered the most visually intuitive for quick analysis?
Understanding these building blocks is the first step in using technical analysis to interpret market behavior and make informed trading decisions.