Mastering Advanced Power BI and Fabric Integration
Star Schema Architecture
The Star Schema Blueprint
When you first start with Power BI, it's tempting to load a single, massive 'flat' table containing everything. This approach works for simple datasets, but it quickly becomes slow and unwieldy as your data grows. The columns are filled with repetitive text, bloating the file size and slowing down every calculation. Professional-grade data architecture demands a more elegant solution.
The key is to separate your data based on its purpose. We split the numbers from the descriptions. This fundamental practice is the basis of the star schema, the gold-standard data model for performance and clarity in Power BI.
A well-structured data model is the foundation of a fast, efficient Power BI dashboard.
The star schema organises your tables into two types: fact tables and dimension tables.
Fact Table
noun
A table containing quantitative, numerical data about a business process. It records what happened. Think sales figures, quantities, or costs. These tables are typically long and narrow.
Dimension Table
noun
A table containing the descriptive, contextual attributes for the data in a fact table. It answers the questions of who, what, where, and when. Examples include customers, products, locations, and dates. These tables are usually shorter and wider than fact tables.
Imagine a sales transaction. The fact is the event itself: the sale of three items for £45. The dimensions provide the context: who made the purchase (customer), what was bought (product), where it happened (store), and when it occurred (date). In a star schema, the fact table sits at the centre, connected to each of the dimension tables through simple, one-to-many relationships.
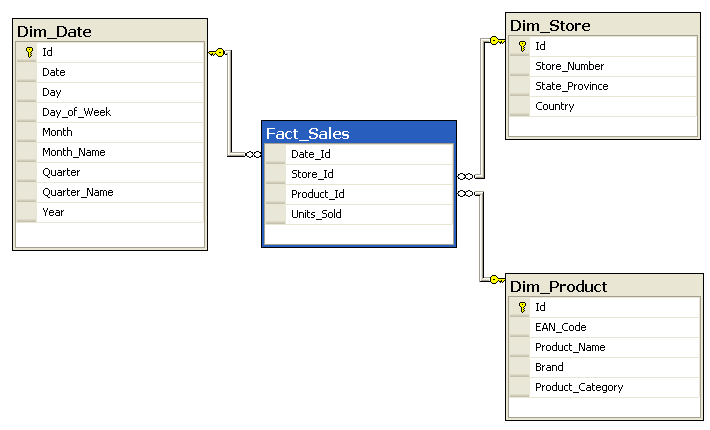
This structure is highly efficient. Instead of storing the full customer name and product description on every single sales row, the fact table only needs to store small, numeric keys. When a query runs, Power BI can quickly filter the small dimension tables and then use those results to scan the much larger fact table. The result is faster reports and simpler, more readable DAX formulas.
Star vs. Snowflake
A common variation of the star schema is the snowflake schema. In a snowflake model, dimension tables are 'normalised', meaning they are broken down into further related tables. For example, a Dim_Product table might be split into a Dim_Product table, a Dim_Subcategory table, and a Dim_Category table, creating a chain of relationships.
While this approach reduces data redundancy, which is a key goal in traditional database design, it comes at a cost for analytics performance. Each additional join in the chain adds complexity and slows down queries. The Power BI engine is highly optimised for the simple, single-join relationships found in a star schema.
For this reason, the best practice in Power BI is to avoid snowflake schemas. Instead, we 'flatten' or 'denormalise' these hierarchies directly into a single dimension table. If your source data has separate tables for products, subcategories, and categories, you should use Power Query to merge them into one wide Dim_Product table before loading the data into the model. This keeps your model lean, your relationships simple, and your DAX efficient.
Pro Tip: Avoid complex snowflake schemas when possible. Flatten hierarchies and denormalize dimensions to simplify relationships and improve data retrieval speed.
Practical Modelling
As you build your star schema, you will encounter a few common challenges. One is managing high-cardinality columns. Cardinality refers to the number of unique values in a column. A column with millions of unique values, like a transaction ID or a customer's email address, can slow down your model if placed in a dimension table.
Think carefully about which columns you truly need for analysis. If a high-cardinality column is purely for transactional look-up and not for slicing or dicing data, it's often best to leave it in the fact table or remove it entirely from the model. Don't create a 'customer' dimension with millions of rows if you only ever analyse them by region or segment. In that case, create a Dim_Region dimension instead.
Finally, always stick to one-to-many relationships flowing from your dimension tables to your fact table. This is the most efficient relationship type. While Power BI allows for other types, like many-to-many, they should be used sparingly as they can introduce ambiguity and performance issues. Always aim for the clean, unambiguous structure of a classic star.
With these principles, you can move beyond simple flat files and begin architecting data models that are scalable, efficient, and easy to maintain.
Why is loading a single, large 'flat' table into Power BI often a poor strategy for professional-grade data models?
In a retail sales data model organised as a star schema, which of the following items belongs in the fact table?