Mastering Advanced EKG Interpretation
Vector Based Analysis
The Heart's Electrical Vector
An ECG doesn't just show electrical activity; it shows the direction of that activity. Think of the heart's overall electrical impulse at any given moment as a single arrow, or vector. This arrow has both a magnitude (how much electricity) and a direction (where it's going). This is the cardiac vector.
At its core, this vector represents a moving wave of depolarization. As positive ions rush into cardiac cells, they create a moving electrical front. This moving positive charge is what we call an electrical dipole—a separation of positive and negative charges. An electrode that 'sees' this wave of positivity coming towards it will record an upward deflection on the ECG. If the wave is moving away, it records a downward deflection. If the wave moves perpendicular to the electrode's line of sight, it records a biphasic or isoelectric line.
The key insight is this: each ECG lead is like a camera looking at the same electrical event from a different angle. The shape of the QRS complex in each lead is just a projection of the same cardiac vector onto that lead's specific line of sight.
The Frontal Plane
To map the cardiac vector in the up-down and left-right directions, we use the six limb leads (I, II, III, aVR, aVL, aVF). When you arrange these six viewpoints around the heart, they form the hexaxial reference system—a circle divided into 30-degree increments.
Lead I looks at the heart from the left side (0 degrees). Lead aVF looks from the feet up (+90 degrees). Lead II combines these, looking from a lower-left angle (+60 degrees). Every limb lead has its own angle, giving us a full 360-degree view of electrical activity in the frontal plane.
The normal ventricular depolarization vector points generally down and to the left, which is the anatomical orientation of the heart. This means it travels roughly along the axis of Lead II. Consequently, a normal ECG will show a strong positive deflection in Lead II and a positive deflection in both Lead I and aVF. Conversely, the vector points directly away from aVR (-150 degrees), which is why aVR normally has a predominantly negative QRS complex.
An upright (positive) QRS in leads I and II is normal (–30 degrees to +105 degrees).
This vector approach is far more powerful than simple pattern recognition. If you see a strong positive QRS in Lead I but a negative QRS in aVF, you can deduce that the electrical axis has shifted leftward, pointing somewhere between 0 and -90 degrees. This is a left axis deviation, and it points toward specific pathologies like left ventricular hypertrophy or a left anterior fascicular block.
The Horizontal Plane
The limb leads give us a great view of the frontal plane, but they don't see front-to-back electrical movement well. For that, we need the six precordial (chest) leads, V1 through V6. These leads are arranged in an arc across the front of the chest, creating a cross-sectional or horizontal plane view.
V1 and V2 are positioned over the right ventricle. V5 and V6 are positioned over the left ventricle. V3 and V4 are in between, over the interventricular septum.
Normal septal depolarization moves from left to right, away from V5/V6 and toward V1. This creates a small initial R wave in V1 and a small initial Q wave in V5/V6. Then, the main wave of depolarization spreads through the thick left ventricle, creating a massive electrical force moving toward V5 and V6. This results in a deep S wave in V1 and a tall R wave in V5/V6. This predictable pattern is called normal R wave progression.
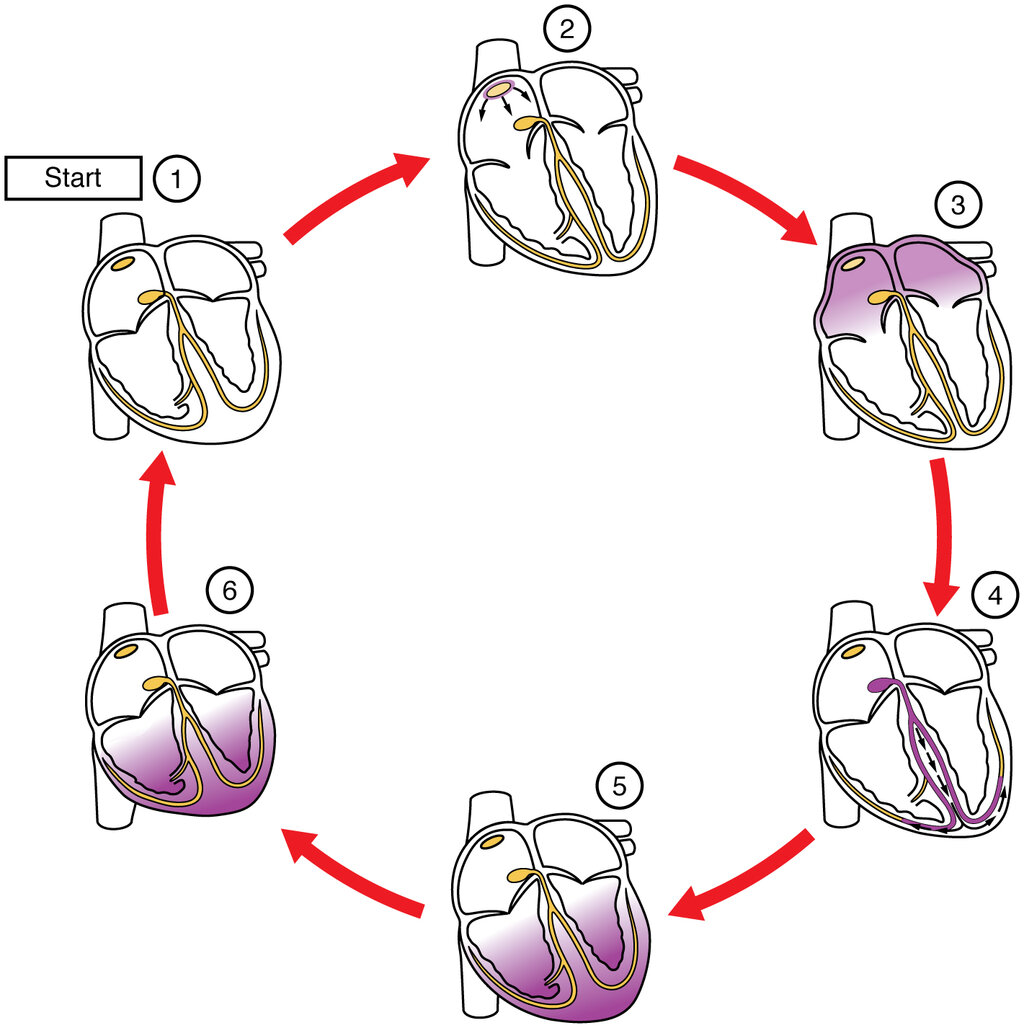
Understanding this horizontal vector explains why certain patterns emerge. For example, in right ventricular hypertrophy, the electrical forces on the right side of the heart increase. The vector shifts rightward (anteriorly). This causes an abnormally tall R wave in V1 and a deep S wave in V6, the opposite of the normal pattern.
Putting It All Together
By combining the frontal and horizontal planes, you get a three-dimensional understanding of the heart's electrical activity. You are no longer just memorizing what a left bundle branch block looks like. Instead, you understand why it produces a wide, predominantly negative QRS in V1 and a wide, notched R wave in V6.
The delayed activation of the left ventricle means the final depolarization vector points strongly to the left and posteriorly, away from V1 and toward V6. This vector-based thinking transforms ECG interpretation from a static recognition task into a dynamic process of electrical deduction.
Let's test your ability to apply these vector concepts.
An electrical dipole moving directly towards a positive ECG electrode will produce which of the following on the tracing?
The hexaxial reference system, formed by the six limb leads (I, II, III, aVR, aVL, aVF), provides a view of the heart's electrical activity in which plane?
This framework allows you to reason through complex or unusual ECGs by returning to the first principles of electrical flow.