Mastering a Single Lecture Slide
Diagram Interpretation
Reading the Blueprint
Diagrams are visual blueprints for ideas. They turn complex information into a clear map, showing how different parts of a system, process, or concept fit together. But like any map, they have a language of their own. Learning to read them isn't about artistic skill; it's about knowing where to look and what questions to ask.
The key is to have a system. Instead of getting overwhelmed by a complex chart, you can tackle it piece by piece. By breaking it down, you can decode its meaning and see the full picture it's trying to show you.
Deconstruct to Understand
The first step in reading any diagram is to break it into its core components. Don't try to absorb everything at once. Instead, scan for the basic building blocks that give the diagram its structure and meaning. It's a bit like identifying the nouns, verbs, and punctuation in a sentence.
Start by looking for these four elements: the title and labels, the symbols and shapes, the lines and arrows, and any use of color or shading. Each one provides a different clue.
First, find the Title and any labels. This is your starting point. The title tells you the diagram’s main subject, like "Project Workflow" or "Water Cycle." Labels identify individual parts, giving you the vocabulary you need to understand the rest.
Next, look at the Symbols and Shapes. Different shapes often represent different kinds of information. Rectangles might be steps in a process, ovals could be start or end points, and diamonds usually signal a decision point. Many diagrams include a legend or key to explain what each symbol means. Always check for one.
Then, trace the Lines and Arrows. These are the verbs of the diagram. They show connections, direction, and flow. A simple line might show a relationship between two items, while an arrow indicates the path from one step to the next. The direction of the arrow is crucial—it tells you the order of operations or the flow of logic.
Finally, notice the Color and Shading. Designers use color to group related items, highlight important parts, or show differences. For example, all tasks assigned to a specific team might be colored blue, or a critical risk might be shaded red.
Connect the Dots
Once you've identified the basic components, the next step is to understand how they work together. This is where you trace the relationships and follow the story the diagram is telling. Don't just look at the pieces in isolation; follow the connections to see the bigger picture.
Start at the beginning, if there is one, and follow the paths. As you move from one shape to the next, ask yourself what the connection means. Is it a sequence, where one thing must happen after another? Is it a hierarchy, showing that some items are sub-parts of others? Or is it a conditional relationship, where the path changes based on a decision?
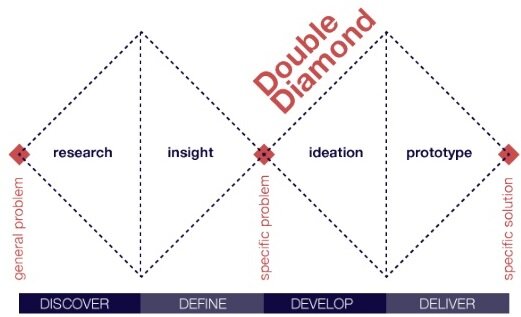
In the Double Diamond model above, the process moves from left to right. The diverging shape of the first diamond shows a phase of discovering many ideas ('Discover'). The converging shape shows the process of narrowing those ideas down to a clear problem ('Define'). The same pattern repeats for developing and delivering a solution. By following the flow, you understand the entire journey from start to finish.
Looking for these patterns helps you extract the core message. You're not just reading a collection of shapes and words; you're understanding a system.
Extract the Insights
The final goal of interpreting a diagram is to pull out meaningful insights. With your understanding of the components and their relationships, you can now ask bigger questions. What is the main point of this diagram? What story is it telling?
Look for the most important path, often called the "critical path" in project management diagrams. Identify any loops, which might represent cycles or repetitive processes. Notice any bottlenecks, where many lines converge on a single point, or decision points that create multiple branches.
Synthesize the information by summarizing the diagram's message in your own words. For a process flow, you might say, "This shows that before we can build the prototype, we must first complete the design and get approval." For a data model, you might conclude, "A user can have multiple posts, but each post can only have one user." This final step turns visual information into actionable knowledge.
Ready to test your understanding? This quiz will cover the key techniques for interpreting diagrams.
When you first encounter a new diagram, what is the recommended initial step for understanding it?
In a process flowchart, what is the primary function of lines and arrows?
By following these steps—deconstructing, connecting, and extracting insights—you can approach any diagram with confidence and pull out the information you need.