Machine Learning for CFD
Introduction to Machine Learning
What is Machine Learning?
Machine learning (ML) teaches computers to learn from data. Instead of writing explicit, step-by-step instructions for every possible scenario, we give the computer examples and let it figure out the patterns on its own.
Think about how you learned to recognize a cat. You weren't given a long list of rules like "must have pointy ears, whiskers, and a long tail." Instead, you saw many examples of cats. Over time, your brain learned to identify the key features. Machine learning works in a similar way. It ingests data, learns the underlying relationships, and then uses that knowledge to make predictions or decisions about new, unseen data.
Two Main Styles of Learning
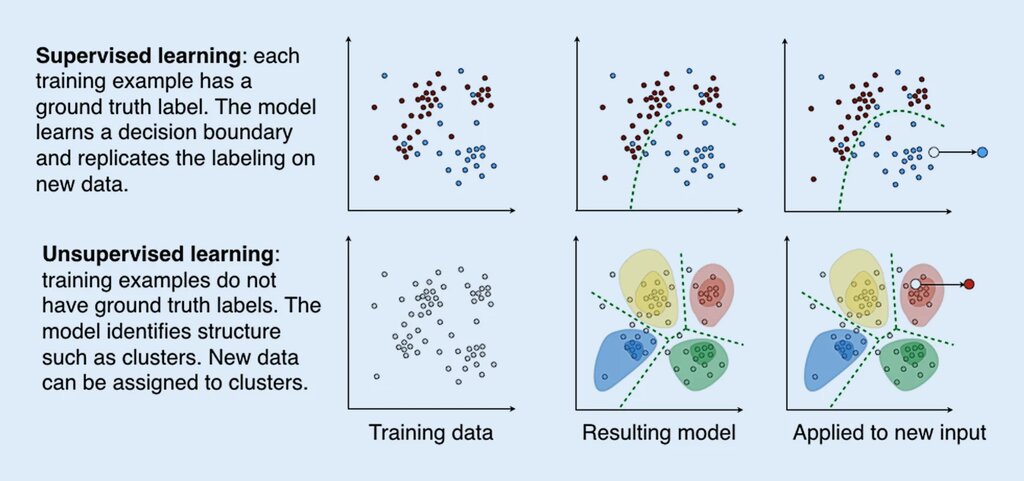
Most machine learning tasks fall into one of two categories: supervised or unsupervised learning. The difference comes down to whether the data has an "answer key."
Supervised learning is like studying for a test with a practice exam that includes the answers. The algorithm is given labeled data—meaning each piece of data is tagged with the correct outcome. The goal is to learn a mapping function that can predict the outcome for new, unlabeled data.
For example, if you want to predict house prices, you would give the model a dataset of houses that includes features like square footage, number of bedrooms, and location, along with the price each house actually sold for. The price is the label. The model learns the connection between the features and the sale price.
Unsupervised learning, on the other hand, is like being given a box of mixed Lego bricks and being asked to sort them. There are no pre-defined categories or labels. The algorithm must examine the data and find its own patterns and structures.
A common use for this is customer segmentation. A company might have data on customer purchasing habits. An unsupervised algorithm could analyze this data and group customers into distinct segments, like "frequent bargain shoppers" or "high-end weekend buyers," without being told these categories exist beforehand.
A Look at Some Common Tools
Just as a carpenter has different tools for different jobs, machine learning practitioners have various algorithms. Let's look at a few fundamental ones.
A linear regression model is one of the simplest tools in the supervised learning toolbox. It's used for predicting a continuous value, like a price or a temperature. It works by finding the best-fitting straight line that describes the relationship between an input variable and an output variable.
The equation for a simple line is likely familiar:
Here, is the value we want to predict, is our input feature, and the model's job is to learn the best values for the slope () and the y-intercept ().
A decision tree is another supervised algorithm, but it can be used for both prediction and classification. It works by splitting the data into smaller and smaller subsets based on a series of yes/no questions, forming a structure that looks like an upside-down tree.
Each path from the root to a leaf represents a decision rule. Because they are easy to visualize and interpret, decision trees are very popular.
Neural networks are more complex models inspired by the structure of the human brain. They consist of interconnected nodes, or "neurons," organized in layers. Each connection has a weight that gets adjusted as the network learns from data. This structure allows them to learn very complex patterns, making them powerful tools for tasks like image recognition and natural language processing.
How Do We Know It's Working?
Creating a model is one thing; knowing if it's any good is another. This is where evaluation metrics come in. They are standard measures used to assess the performance of a model.
Accuracy
noun
The proportion of predictions the model got right. It's calculated by dividing the number of correct predictions by the total number of predictions.
While accuracy is intuitive, it's most useful for classification tasks where the classes are balanced. For regression tasks, where we predict a continuous number, we need a different metric.
Mean Squared Error (MSE) measures the average of the squares of the errors—that is, the average squared difference between the estimated values and the actual value. A smaller MSE indicates a better fit.
In this formula, is the number of data points, is the actual value, and is the value predicted by the model. Squaring the error ensures that negative and positive errors don't cancel each other out and it penalizes larger errors more heavily.
These fundamental concepts are the building blocks of the machine learning field. Understanding them is the first step toward applying these powerful techniques to solve real-world problems.