Linear Regression Models Explained
Introduction to Linear Regression
Finding Simple Relationships
Imagine you're trying to figure out if there's a connection between two things. For example, does the number of hours you study affect your test score? Or does a car's age influence its price? Linear regression is a statistical tool that helps us answer these kinds of questions.
It works by finding a simple, straight-line relationship between two variables. We call these variables the independent and dependent variables.
independent variable
noun
The variable that you believe has an effect on another variable. It's the 'cause' or the input. In our example, 'hours studied' is the independent variable.
The independent variable is what we think predicts or explains the change in the other variable.
dependent variable
noun
The variable that is being measured or tested. It's the 'effect' or the output, and it 'depends' on the independent variable. 'Test score' is our dependent variable.
Linear regression has two main goals: to understand the strength of the relationship between these two variables and to predict future outcomes. For instance, we could use it to predict a student's likely test score based on the hours they plan to study.
The Line of Best Fit
To visualize the relationship, we can plot our data on a simple graph called a scatter plot. Each point on the plot represents one observation, like one student's study hours and their corresponding test score. Usually, the points won't form a perfect line. They'll be scattered.
Linear regression finds the one straight line that cuts through the data in a way that best represents the overall trend. This is called the 'line of best fit'.
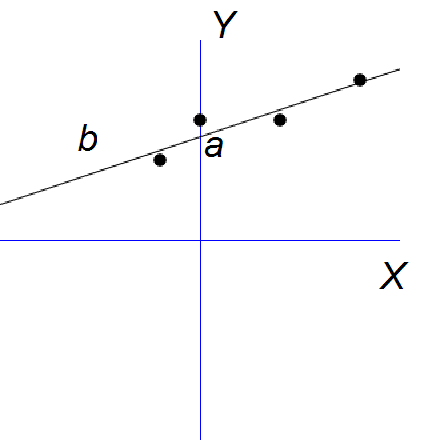
This line follows the classic equation you might remember from algebra:
In this equation:
- is the dependent variable (the value we want to predict).
- is the independent variable (the value we use to make the prediction).
- is the slope of the line. It tells us how much we expect to change for every one-unit increase in .
- is the y-intercept. It's the value of when is zero.
The goal of linear regression is to find the perfect values for the slope () and the y-intercept () that create the best possible line for our data.
Finding the Best Line
How does a computer decide which line is 'best'? It uses a technique called the Method of Least Squares.
First, imagine any possible line drawn through our scatter plot. For each data point, we can measure the vertical distance between the point and the line. This distance is called a 'residual' or an 'error'. It shows how far off the line's prediction is from the actual data.
A small residual means the line is a good predictor for that specific data point. A large residual means it's a poor predictor.
To find the best line, we can't just add up these residuals. Some will be positive (above the line) and some negative (below the line), and they might cancel each other out. To solve this, we square each residual. This makes all the errors positive and gives more weight to larger errors.
Finally, we add up all of these squared residuals. The Method of Least Squares finds the one unique line where this sum of squared residuals is as small as possible. In other words, it minimizes the total error.
This method gives us the most accurate slope and intercept, creating a line that is, on average, closest to all the data points simultaneously.
Real-World Applications
Linear regression is more than just a mathematical exercise; it's used everywhere. Its simplicity and clarity make it a powerful first step in many analyses.
-
Economics: Economists use it to predict consumer spending based on income levels or to see how changes in interest rates might affect the stock market.
-
Business: A company might use linear regression to forecast sales based on its advertising budget. How much more revenue can they expect for every extra $1,000 spent on ads?
-
Healthcare: Researchers can model the relationship between variables like dosage of a drug and a patient's blood pressure, or between hours of sleep and cognitive performance.
-
Environmental Science: Scientists might analyze the relationship between carbon dioxide emissions and the rise in global temperatures.
In all these cases, linear regression provides a simple model to understand how one thing changes in relation to another.
What is the primary goal of linear regression?
In the linear regression equation , the 'm' term represents the slope of the line.
Linear regression is a foundational concept in data analysis, offering a straightforward way to model and understand the relationships that drive the world around us.