Linear Functions Equations and Inequalities
Understanding Linear Functions
What Makes a Function Linear?
A linear function describes a relationship with a constant rate of change. If you plot one on a graph, it always forms a perfectly straight line. This steady, predictable change is what makes linear functions so useful for modeling real-world situations.
The standard equation for a linear function is often written as:
In this formula, is the input variable and is the output variable. The two key parts are and :
- is the slope: It tells you how steep the line is and which direction it's going (uphill or downhill).
- is the y-intercept: This is the point where the line crosses the vertical y-axis.
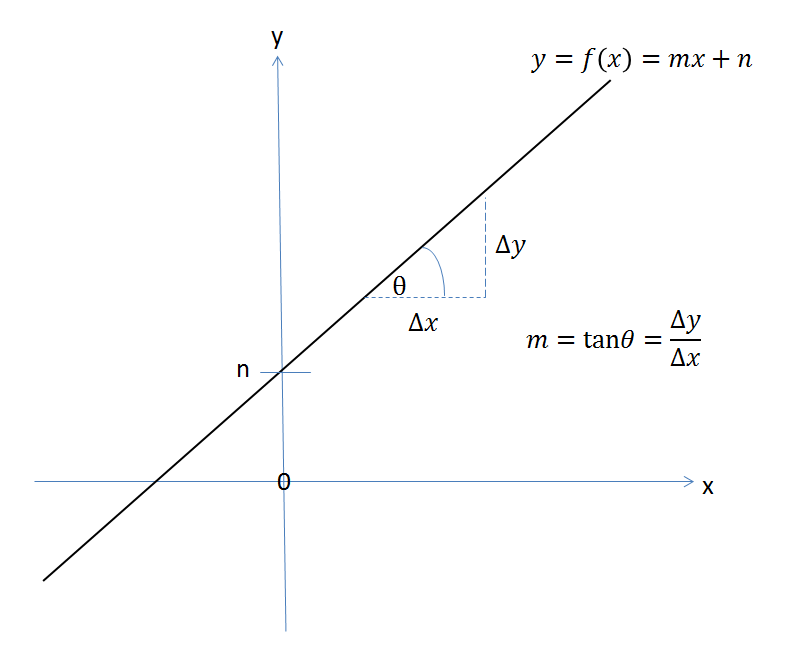
You can also spot a linear relationship by looking at a table of values. If the y-value increases or decreases by the same amount every time the x-value increases by one step, you're looking at a linear function. This constant change is the slope in action.
For a linear function, the rate of change between any two points is always the same.
| X-value | Y-value (for y = 2x + 1) | Change in Y |
|---|---|---|
| 0 | 1 | - |
| 1 | 3 | +2 |
| 2 | 5 | +2 |
| 3 | 7 | +2 |
Notice how for every 1-unit increase in , the -value consistently increases by 2. This constant change of 2 is the slope of the line.
Slope and Y-Intercept
Let's break down the two components that define a linear function's graph: slope and y-intercept.
slope
noun
A number that measures the steepness and direction of a line. It's calculated as the change in the vertical direction (rise) divided by the change in the horizontal direction (run).
The slope, , tells you the story of the line's journey:
- Positive Slope (): The line goes up from left to right. A larger number means a steeper climb.
- Negative Slope (): The line goes down from left to right. A more negative number (like -5 vs -2) means a steeper descent.
- Zero Slope (): The line is perfectly flat, or horizontal.
y-intercept
noun
The point where a line crosses the vertical y-axis. It is the value of y when x is 0.
The y-intercept, , gives you a starting point. It's the value of when is zero. For the equation , the y-intercept is 1. This means the line crosses the y-axis at the point .
Graphing a Linear Function
Graphing a linear function is straightforward once you know the slope and y-intercept. Let's use the function as an example.
Step 1: Plot the y-intercept. The equation is in the form . Here, . So, our starting point is where the line crosses the y-axis, which is at . Find -1 on the y-axis and mark that point.
Step 2: Use the slope to find a second point. The slope, , is 2. We can write this as a fraction, . The slope is "rise over run," so this means from our y-intercept, we need to "rise" 2 units (go up 2) and "run" 1 unit (go right 1).
Starting from , move up 2 units to , then move right 1 unit to . Mark your new point at .
Step 3: Draw the line. With two points, and , you can now draw a straight line that passes through both of them. This line represents all the possible solutions to the equation .
Linear Functions in the Real World
Linear functions appear all the time in everyday life because many things involve a constant rate of change.
Think about a taxi fare. There's often a flat fee just for getting in the cab, plus an additional cost for every mile you travel. This is a perfect linear relationship.
Imagine a taxi charges a $3 flat fee and $2 per mile. The total cost () for a trip of miles can be modeled by the equation:
Here, the slope () is the cost per mile, and the y-intercept () is the initial flat fee. You can use this function to predict the cost of any trip.
How much would a 10-mile trip cost?
Another example is calculating your distance when traveling at a constant speed. If you're driving at 60 miles per hour, your distance traveled () after hours is . This is a linear function where the y-intercept is 0 (since you've traveled 0 miles at 0 hours) and the slope is 60.
Let's check your understanding of these core concepts.
In the linear equation , what does the 'm' represent?
If a linear function has a negative slope, how will its graph appear?
By recognizing the slope and y-intercept, you can understand, graph, and use linear functions to make sense of the world around you.