Investing Strategies and Applications
Investment Risk Assessment
The Risk-Return Balancing Act
Every investment involves a trade-off. To get a higher potential return, you generally have to accept a greater level of risk. This is the fundamental balancing act of investing. Think of it like a seesaw: as one side (return) goes up, the other side (risk) must also rise to maintain balance. The key isn't to avoid risk entirely—that would mean avoiding returns—but to understand and manage it effectively.
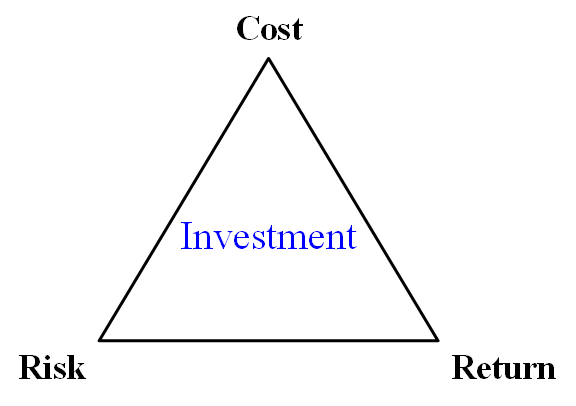
Your goal as an investor is to find the sweet spot on this seesaw that aligns with your financial goals and your personal tolerance for uncertainty. This requires moving beyond a gut feeling about risk and using specific tools to measure it.
Putting a Number on Risk
To manage risk, we first need to measure it. Quantitative tools turn the abstract concept of risk into a concrete number, allowing for clear comparisons and informed decisions. These metrics help us understand an asset's volatility and potential for loss.
Three common metrics for quantifying risk are Standard Deviation, Beta, and Value at Risk (VaR).
Standard Deviation (σ) measures how much an investment's returns have varied from its average return over a period. A high standard deviation means the returns have been all over the place—high volatility. A low standard deviation indicates returns have been more stable and predictable.
For example, if a stock has an average annual return of 8% and a standard deviation of 15%, you can reasonably expect its return in most years to fall somewhere between -7% (8% - 15%) and 23% (8% + 15%).
Beta (β) measures a stock's volatility relative to the overall market (often represented by an index like the S&P 500). The market itself has a beta of 1.0.
- A beta greater than 1.0 means the stock is more volatile than the market. If the market goes up 10%, a stock with a beta of 1.2 is expected to go up 12%.
- A beta less than 1.0 means the stock is less volatile than the market. Utility stocks, for example, often have low betas.
- A negative beta means the stock tends to move in the opposite direction of the market, which is rare.
Value at Risk (VaR) is a statistic that estimates the maximum potential loss an investment portfolio could face over a specific time period, for a given confidence level. It answers the question: "What's the most I can expect to lose on a typical bad day?"
For instance, a one-day VaR of $1 million with 95% confidence means that on 95 out of 100 days, you would not expect to lose more than $1 million. There is, however, a 5% chance that your losses could exceed that amount.
Overview of risk measurement and management techniques, including Value at Risk (VaR), stress testing, and portfolio optimization methods.
Playing Out the 'What Ifs'
While historical data is useful, the future is never a perfect reflection of the past. This is where forward-looking techniques like scenario analysis and stress testing become critical. They help you prepare your portfolio for what could happen, not just what has happened.
Scenario Analysis
noun
A process of examining and evaluating possible future events by considering alternative possible outcomes (scenarios).
Scenario analysis involves modeling how your portfolio might perform under different hypothetical, but plausible, future conditions. You might create scenarios for:
- A moderate recession: GDP contracts by 2%, and unemployment rises.
- An oil price shock: The price of crude oil doubles in three months.
- A shift in interest rates: The central bank raises rates by 1.5%.
By running these simulations, you can identify which parts of your portfolio are most vulnerable to specific economic changes and adjust your strategy accordingly.
Stress Testing is a more intense form of scenario analysis. It focuses specifically on extreme, low-probability, high-impact events. The goal isn't just to see what happens in a mild downturn, but to understand your portfolio's breaking points during a crisis.
Think of the difference this way: scenario analysis might model a typical rainstorm, while stress testing models a Category 5 hurricane.
| Technique | Focus | Example |
|---|---|---|
| Scenario Analysis | Plausible future economic paths | How would my portfolio perform if inflation stays at 4% for the next two years? |
| Stress Testing | Extreme, but possible, crises | What would happen to my investments if a major bank fails, like in 2008? |
These forward-looking tools don't predict the future, but they do make a portfolio more resilient. By understanding how your investments might behave under pressure, you can build a more robust strategy prepared for a wider range of outcomes.
What is the fundamental principle of the risk-return trade-off in investing?
A stock has an average annual return of 10% and a standard deviation of 18%. Based on this, in most years, its return can be reasonably expected to fall within what range?
Assessing investment risk is an ongoing process of balancing potential returns with potential losses, using both historical data and forward-looking analysis to build a resilient portfolio.