Introduction to Statistics
Introduction to Statistics
What is Statistics?
Statistics is the science of collecting, analyzing, and interpreting data. It's a way to make sense of the world by turning raw information into meaningful insights. Think of it as a toolkit for understanding patterns, making decisions, and dealing with uncertainty.
Every day, we're surrounded by statistics. When you hear a news report about a political poll, that's statistics. When a doctor discusses the effectiveness of a new drug, they're using statistics. Companies use it to understand what customers want, and scientists use it to test new theories. It’s a powerful language for communicating complex information clearly.
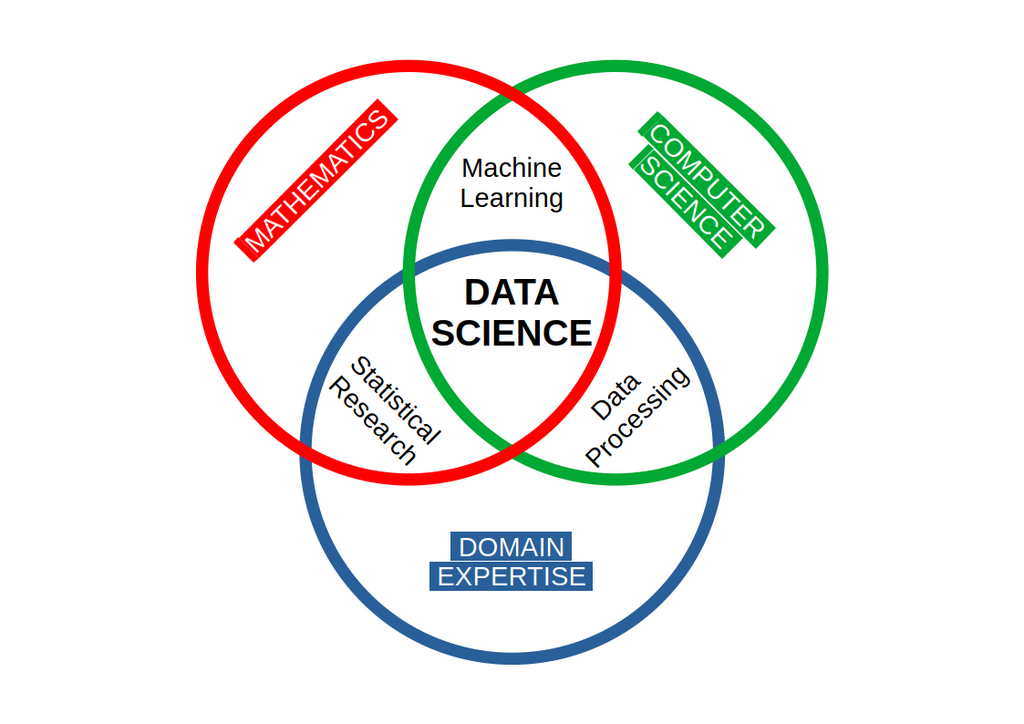
Two Branches of Statistics
Statistics is generally divided into two main areas: descriptive and inferential statistics. They serve different, but equally important, purposes.
Descriptive statistics summarizes or describes the characteristics of a data set. It simply shows what the data looks like.
Imagine you have the test scores for a class of 30 students. Descriptive statistics could be used to calculate the average score, find the most common score, or determine the range from the highest to the lowest score. These are straightforward summaries. You're not trying to draw conclusions about any other class; you're just describing this one.
Inferential statistics uses data from a small group to make educated guesses, or inferences, about a larger group.
Let's stick with the test scores. Instead of having scores for every student in a country, you might only have scores from a few hundred students. Using inferential statistics, you could estimate the average test score for all students in the entire country based on your smaller group. It’s about using a sample to understand the whole population.
The Language of Statistics
To work with statistics, you need to know a few key terms. These form the basic vocabulary for any data analysis.
population
noun
The entire group that you want to draw conclusions about.
sample
noun
A specific group that you will collect data from. It is a subset of the population.
The relationship between a population and a sample is central to statistics. We study the sample to understand the population. For this to work, the sample must be a good representation of the larger group.
variable
noun
A characteristic or property of an individual item in a population or sample. It's something that can be measured or counted.
Types of Data
The variables we measure give us data. This data can be broken down into two main types: qualitative and quantitative. Understanding the type of data you have is the first step in deciding how to analyze it.
Qualitative data (or categorical data) describes qualities or characteristics. It is collected in the form of words, labels, or descriptions.
Quantitative data deals with numbers and things you can measure. It can be counted or measured and then recorded with a number.
| Data Type | Description | Examples |
|---|---|---|
| Qualitative | Describes categories or qualities. | Eye color (blue, green, brown), type of car (sedan, SUV), yes/no answers. |
| Quantitative | Represents counts or measurements. | Height, weight, temperature, number of siblings, test scores. |
Knowing these fundamental concepts is the first step. They provide the framework for all the statistical methods you will encounter later.
What is the primary purpose of statistics?
A researcher calculates the average GPA for every student in a single, specific classroom. What type of statistics is being used?