Introduction to Statistics
Introduction to Statistics
What Is Statistics?
Statistics is the science of learning from data. It’s a set of tools that helps us collect, analyze, and interpret information. Think of it as a guide for navigating a world full of numbers and uncertainty. It helps us find patterns, make decisions, and understand complex situations, from predicting the weather to figuring out if a new medicine works.
In short, statistics turns raw data into useful knowledge.
Without it, we'd be drowning in information but starving for wisdom. By understanding the fundamentals, you can start to see the stories hidden within the data all around you.
Types of Data
Before we can analyze anything, we need to understand what we're working with. Data generally falls into two main categories: qualitative and quantitative.
Qualitative Data
adjective
Describes qualities or characteristics. It is collected through observations and is often represented by names or labels.
This type of data answers questions like "what kind?" or "which category?" Think of eye color (blue, brown, green), types of cars (sedan, SUV, truck), or your favorite music genre (rock, pop, hip-hop). You can't perform mathematical calculations with it in a meaningful way.
Quantitative Data
adjective
Data that can be measured or counted and is expressed numerically. It can be used in mathematical calculations.
This is numerical data that answers questions like "how much?" or "how many?" Examples include your height in centimeters, the temperature outside in degrees, or the number of students in a class.
Quantitative data can be further split into two types:
- Discrete: Data that can only take specific, countable values. You can't have 2.5 siblings or 1.8 cars. The number of pets you own is discrete data.
- Continuous: Data that can take any value within a range. Your weight, height, and the time it takes to run a mile are all continuous. There are infinite possibilities between any two values.
Levels of Measurement
Just because something is a number doesn't mean we can treat it like any other number. Data can be classified into four levels of measurement, each with its own rules. These levels determine what kind of mathematical operations are appropriate.
| Level | Description | Example |
|---|---|---|
| Nominal | Categorical data without any intrinsic order. | Marital status (Single, Married, Divorced), Eye color. |
| Ordinal | Categorical data with a meaningful order or rank. | Survey responses (Disagree, Neutral, Agree), Education level. |
| Interval | Ordered data with equal intervals between values, but no true zero. | Temperature in Celsius/Fahrenheit, SAT scores. |
| Ratio | Ordered data with equal intervals and a true zero point. | Height, weight, age, bank account balance. |
The key difference between interval and ratio data is the "true zero." A true zero means the complete absence of the thing being measured. For example, 0°C is just a point on a scale; it doesn't mean there is no temperature. However, a weight of 0 kg means there is no weight at all. This distinction is important for calculations. You can say someone who is 2 meters tall is twice as tall as someone who is 1 meter tall (ratio), but you can't say 20°C is twice as hot as 10°C (interval).
Statistics in the Real World
Understanding these concepts isn't just academic. Statistics is a powerful tool used in almost every field imaginable.
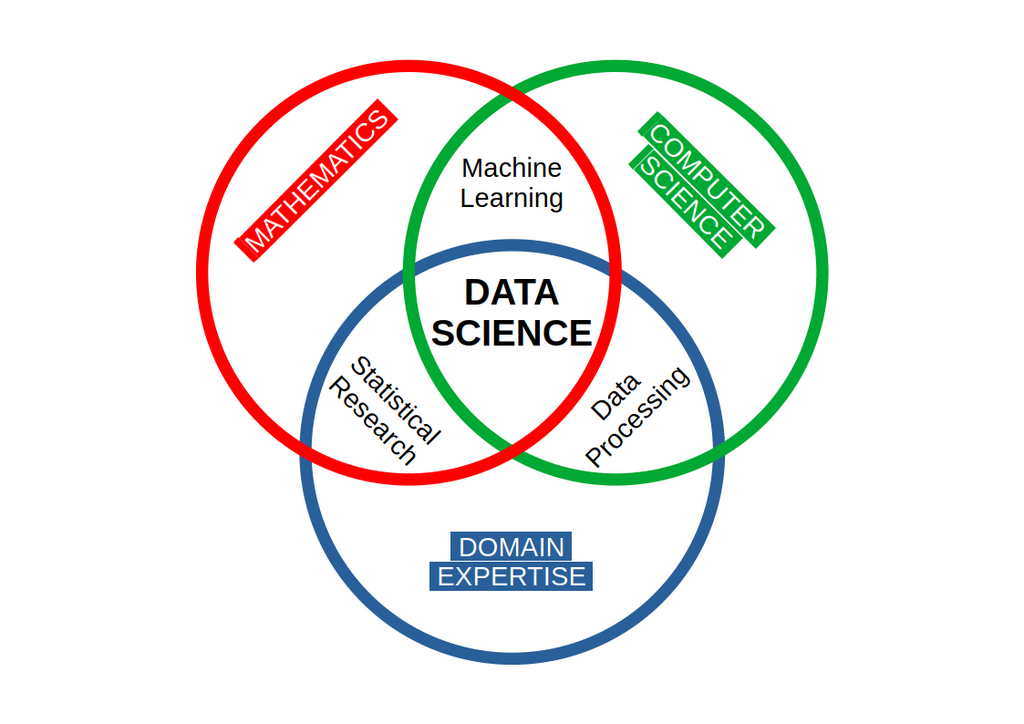
- In healthcare, doctors use statistics to evaluate the effectiveness of new treatments through clinical trials. Epidemiologists track the spread of diseases to prevent outbreaks.
- In business, companies analyze customer data to understand purchasing habits and improve their products. Financial analysts use statistics to assess risk and forecast market trends.
- In sports, teams use statistics to analyze player performance, scout opponents, and develop game strategies. Everything from a baseball player's batting average to a basketball team's shooting efficiency is a product of statistical analysis.
- In government, agencies like the Census Bureau collect data on population, housing, and the economy. This information is vital for making decisions about infrastructure, social programs, and resource allocation.
Now that you have a handle on the basic vocabulary of statistics, let's test your knowledge.
Which of the following best describes the primary goal of statistics?
A coffee shop tracks the number of espressos sold each day. What kind of data is this?
These foundational ideas are the building blocks for everything else you'll learn in statistics. Mastering them will prepare you to start exploring and making sense of data on your own.