Introduction to Statistics
Introduction to Statistics
What is Statistics?
Statistics is the science of learning from data. It gives us the tools to collect, analyze, and interpret information to make better decisions. Think about the last time you checked the weather forecast. Meteorologists use statistical models, analyzing historical weather patterns and current conditions, to predict the chance of rain. That's statistics in action.
In short, statistics helps us find patterns and meaning in a world full of numbers and information.
From business and medicine to sports and social media, statistics is everywhere. A company might analyze customer feedback to improve its products. A doctor might review clinical trial data to see if a new drug is effective. Even a baseball manager uses player statistics to decide the batting order. Understanding the basics helps you see the world more clearly and critically evaluate the claims you encounter every day.
Two Sides of the Same Coin
The field of statistics is generally divided into two main branches: descriptive and inferential statistics. They work together, but they have different goals.
Descriptive statistics consists of the collection, organization, summarization and presentation of data.
Descriptive statistics is all about summarizing the data you have. It describes what the data shows in a simple, understandable way. If you survey 100 people and find that the average age is 35, that average is a descriptive statistic. It's a straightforward summary of your group.
Inferential statistics consists of the generalizing from samples to population, performing estimations and hypothesis test, determining relationships among variables, and make predictions.
Inferential statistics takes things a step further. It uses data from a small group to make educated guesses, or inferences, about a much larger group. For example, a political pollster might survey 1,000 voters to predict how an entire country will vote. They are using the sample data to infer something about the larger population.
| Feature | Descriptive Statistics | Inferential Statistics |
|---|---|---|
| Goal | To summarize and describe data. | To make predictions or inferences about a larger group. |
| Focus | The data you have collected. | Using your data to draw conclusions about a larger group. |
| Example | Calculating the average grade on a test for one classroom. | Using that classroom's average to estimate the average grade for all students in the school. |
The Big Picture and the Snapshot
To understand the difference between descriptive and inferential statistics, you need to know about populations and samples. The terms sound simple, but they have very specific meanings.
Population
noun
The entire group that you want to draw conclusions about.
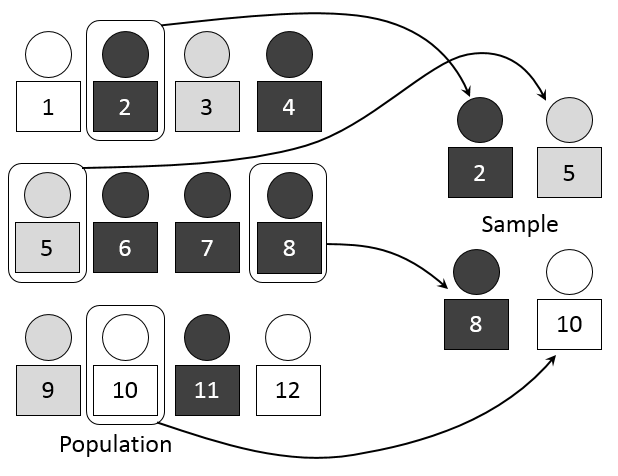
A population isn't always about people. It could be all the cars produced by a factory, all the trees in a forest, or every star in a galaxy. The key is that it includes every single member of the group of interest. Studying an entire population is often impractical or impossible because it can be too large, too expensive, or too time-consuming to collect data from everyone.
That's where samples come in.
Sample
noun
A specific, smaller group of individuals selected from a population.
Think of it like tasting a spoonful of soup to know what the whole pot tastes like. The pot is the population, and the spoonful is the sample. Inferential statistics helps us determine how confident we can be that our spoonful accurately represents the entire pot.
Parameters and Statistics
Just as populations and samples are linked, so are parameters and statistics. These terms describe the numerical measurements we get from each group.
A parameter is a number that describes a characteristic of a population. A statistic is a number that describes a characteristic of a sample.
It's easy to remember: Parameter for Population, and Statistic for Sample.
Imagine we want to know the average height of all adult women in Canada (the population). That true average height is a parameter. Since we can't measure every woman, we take a sample of, say, 1,000 women and calculate their average height. This calculated average is a statistic.
The goal of inferential statistics is often to use a sample statistic (like the average height of 1,000 women) to estimate a population parameter (the average height of all women).
| Measurement | Describes a... | Example |
|---|---|---|
| Parameter | Population | The true average income of every household in a city. |
| Statistic | Sample | The average income calculated from a survey of 200 households in that city. |
And there you have it. You've just learned the foundational concepts of statistics. It’s a field built on the relationship between what we can observe (samples and statistics) and what we want to know (populations and parameters).
A political pollster surveys 1,000 registered voters to predict the outcome of a national election involving millions of voters. The main goal of this process falls under which branch of statistics?
A quality control manager at a car factory wants to know the average fuel efficiency of all the cars produced in a month. What is this average fuel efficiency considered?