Introduction to Stata
Introduction to Stata
Getting Started with Stata
Stata is a powerful tool for anyone who works with data. Think of it as a super-smart calculator and organizer designed specifically for statistical analysis. Researchers in fields like economics, sociology, public health, and political science use it to explore data, create visualizations, and build statistical models.
Whether you're trying to understand the relationship between education levels and income, or the effectiveness of a new medical treatment, Stata provides the tools to manage your data, analyze it, and present your findings clearly. It's popular in both academic and professional settings because it's flexible and reliable.
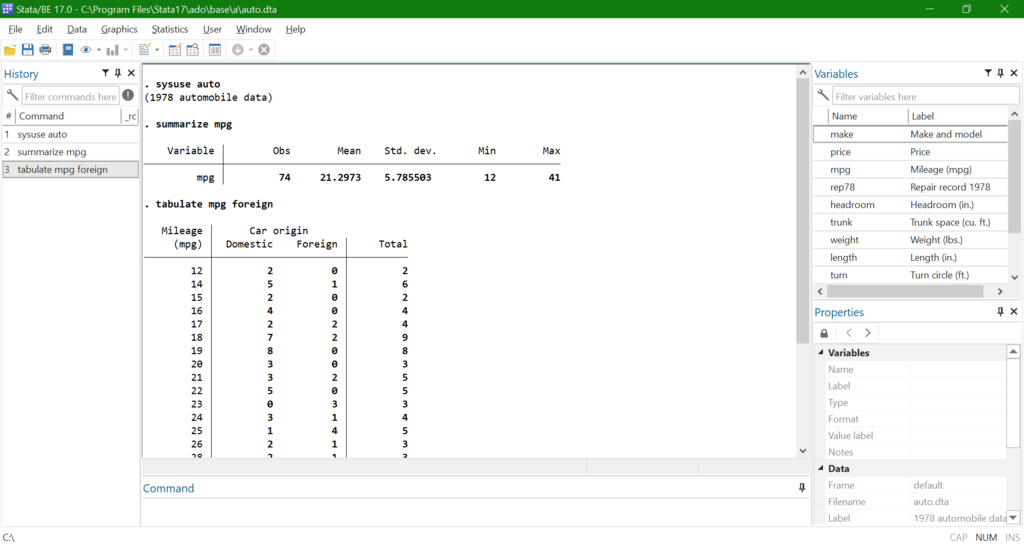
The Stata Workspace
When you first open Stata, you'll see several windows. It might look a bit busy, but each window has a specific job. Learning what they do is the first step to feeling comfortable in the Stata environment.
Here’s a quick tour of the main players:
- Command Window: This is where you type your instructions to Stata. You tell it what to do, press Enter, and Stata gets to work.
- Results Window: This is where Stata talks back to you. It displays the output from the commands you run, like tables, statistics, and other results.
- Review Window: This keeps a running list of all the commands you've entered. It’s a handy history log that lets you easily re-run a previous command without retyping it.
- Variables Window: This window lists all the variables in your current dataset. It gives you a quick overview of what data you have to work with.
Speaking Stata's Language
Interacting with Stata is like having a conversation, but you need to use its specific language. This language is called Stata's command syntax. The good news is that the structure is very consistent. Most commands follow a logical pattern.
The basic structure is: command, what to do it to, and any special conditions or options.
Let's look at a very common command, summarize. This command gives you basic descriptive statistics for a variable, like the mean, standard deviation, and minimum/maximum values. If you wanted to summarize a variable named mpg (miles per gallon), you would type:
// The command is 'summarize'
// The variable is 'mpg'
summarize mpg
After you press Enter, Stata will process your request and show a table with the summary statistics in the Results window. You can also summarize all variables in the dataset by simply typing summarize with no variable name after it.
Many commands also have options that modify how they work. Options are added at the end of the command after a comma. For example, the detail option for the summarize command provides more in-depth statistics.
// The comma tells Stata that an option is coming
summarize mpg, detail
This consistent structure makes learning new commands easier. Once you understand the basic syntax, you can often guess how to use a new command just by reading its name and thinking about what options it might have.
Ready to check your understanding?
What is the primary purpose of Stata in professional and academic settings?
In the Stata interface, which window keeps a history of the commands you have executed, allowing you to easily reuse them?
That's the basic tour of Stata. By understanding its purpose and the layout of its workspace, you're ready to start exploring data.