Introduction to Regression Models
Introduction to Regression
Finding Relationships in Data
How much does an extra hour of studying improve your test score? If a coffee shop is on a busier street, how many more customers can it expect? These questions try to connect two different things: a cause and an effect. Answering them is the core idea behind regression analysis.
Linear regression analysis is used to predict the value of a variable based on the value of another variable.
At its heart, regression is a statistical tool that helps us understand and quantify the relationship between different factors, or variables. It builds a mathematical model to predict a particular outcome. This doesn't just tell us if two variables are connected; it shows us how they are connected. For example, it can help us estimate exactly how much a house's price tends to increase for every additional square foot of space.
The Key Players
Every regression model has two main types of variables. Understanding their roles is crucial.
Independent Variable
noun
The variable that is changed or controlled in an experiment to test its effects on another variable. It's the presumed cause.
Think of this as the input or the factor you are adjusting. It's also known as a predictor or explanatory variable.
Dependent Variable
noun
The variable being tested and measured in an experiment. It's the presumed effect, and its value depends on the independent variable.
This is the outcome you want to predict or explain. It's also called the response or target variable.
For example, if we're examining the link between advertising spending and sales, spending is the independent variable (the cause we can control) and sales is the dependent variable (the effect we're measuring).
Where Did It Come From?
The concept of regression emerged in the 19th century from the work of Sir Francis Galton, a cousin of Charles Darwin. While studying heredity, Galton noticed an interesting pattern. He found that very tall parents tended to have children who were also tall, but slightly shorter than them. Similarly, very short parents had children who were short, but slightly taller than them.
He called this phenomenon "regression to the mean." The children's heights seemed to regress, or move back, toward the average height of the population. This foundational idea of a predictable relationship between variables, even with natural variation, paved the way for the statistical techniques we use today.
Regression in the Wild
Regression isn't just an academic concept. It's a practical tool used across countless industries to make better decisions.
- Business: Companies use regression to forecast future sales based on past performance, seasonality, and marketing budgets.
- Finance: Investors model the price of a stock based on factors like company earnings, interest rates, and market indices.
- Healthcare: Doctors can predict a patient's risk for a certain disease by analyzing variables like age, weight, and blood pressure.
- Environmental Science: Scientists study the impact of pollution levels on local wildlife populations.
These applications all share a common goal: using known information (independent variables) to make an informed prediction about an unknown or future outcome (the dependent variable).
The Basic Process
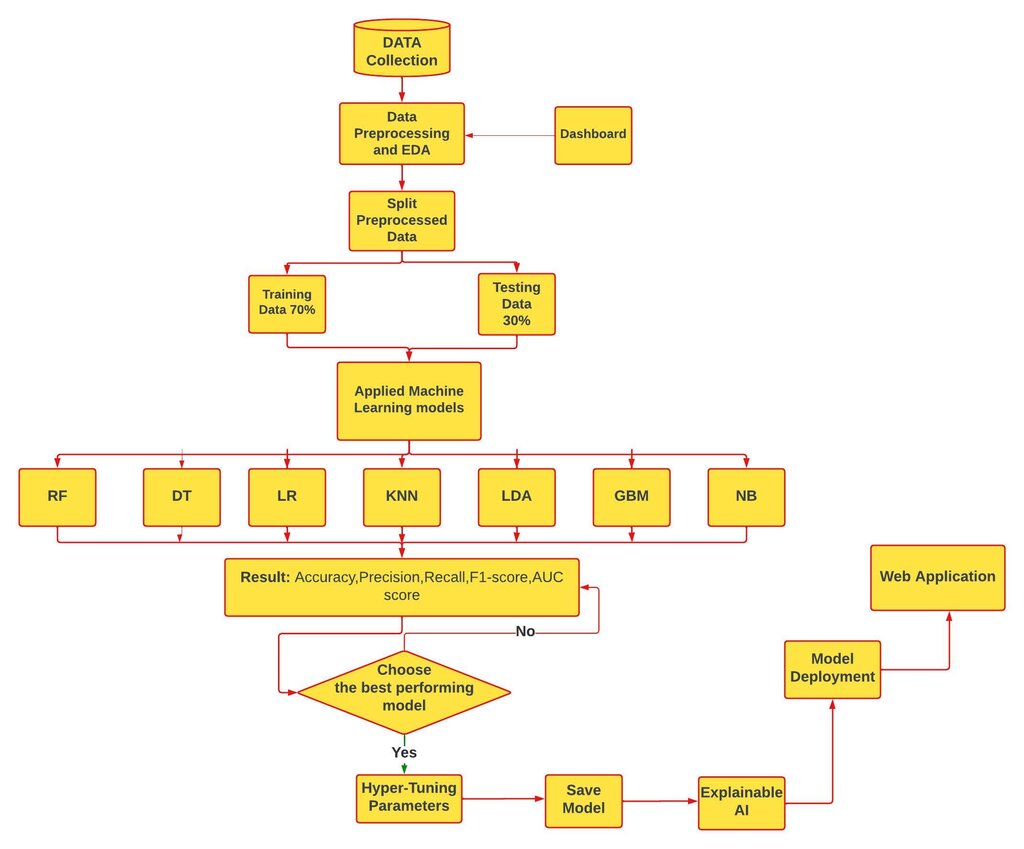
Creating a regression model involves a few key steps. While the math can get complex, the overall process is quite logical.
| Step | Action | Purpose |
|---|---|---|
| 1. Collect Data | Gather information on your independent and dependent variables. | You need historical data to find the relationship. |
| 2. Choose a Model | Select the type of regression that best fits the data. | A straight line (linear regression) is the simplest starting point. |
| 3. Train the Model | Use the data to "teach" the model the relationship. | This step finds the mathematical equation that best describes the data. |
| 4. Evaluate the Model | Check how well the model's predictions match the actual data. | Ensures your model is accurate and reliable before you use it. |
| 5. Make Predictions | Use the trained model on new data to forecast future outcomes. | This is the ultimate goal: turning data into actionable insights. |
This process allows data scientists and analysts to move from raw data to a powerful predictive tool.
What is the primary goal of regression analysis?
An urban planner is studying public transit. They want to predict the number of daily bus riders based on the price of a bus ticket. In this model, the price of a bus ticket is the ________ variable.
By understanding these core concepts, you've taken the first step into the powerful world of predictive analysis.