Introduction to Linear Regression
Introduction to Linear Regression
Finding Patterns with Lines
How much should a house cost? How many ice cream cones will you sell on a hot day? These questions seem different, but you can approach them in a similar way: by looking for relationships in data. This is the core idea behind linear regression.
Linear regression is a way to model the relationship between two variables by fitting a straight line to the observed data. One variable is what we're trying to predict, called the dependent variable. The other is what we're using to make the prediction, called the independent variable.
Think of it like drawing the most helpful straight line through a cloud of data points. The line summarizes the pattern.
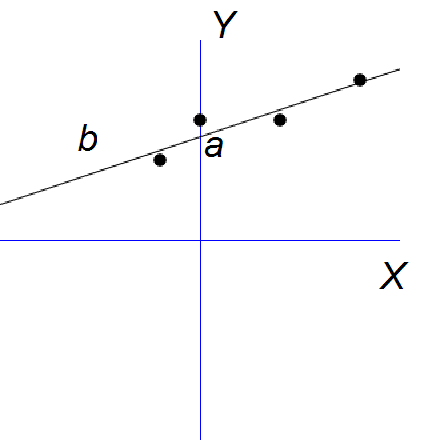
The goal isn't to connect all the dots perfectly. Real-world data is messy. Instead, the line of best fit cuts through the middle of the data, capturing the general trend. Once we have this line, we can use it to make educated guesses, or predictions, about new data.
Real-World Predictions
This simple idea is incredibly powerful and used in many fields. Economists use it to predict consumer spending based on income levels. Farmers might use it to estimate crop yield based on the amount of rainfall. In medicine, it can help model the relationship between drug dosage and patient blood pressure.
Linear regression analysis is used to predict the value of a variable based on the value of another variable.
Let's take a simple business example. Imagine you run a small online store and you want to know how your spending on digital ads affects your sales. For a few months, you track both.
| Month | Ad Spend (in $) | Monthly Sales (in $) |
|---|---|---|
| Jan | 500 | 7,000 |
| Feb | 600 | 8,500 |
| Mar | 750 | 9,000 |
| Apr | 900 | 11,000 |
Looking at the table, you can see a general trend: when ad spending goes up, sales also tend to go up. Linear regression formalizes this intuition. It would draw a line through these data points to model that relationship. With that model, you could predict your likely sales if you spent, say, $800 on ads next month.
By understanding this basic tool, you've taken the first step toward understanding how data scientists, economists, and researchers make sense of the world and predict what might happen next. It's a foundational building block for many more advanced techniques in statistics and machine learning.
What is the primary goal of linear regression?
In a model predicting house prices based on square footage, 'house price' is the ______ variable.