Introduction to Linear Regression
Introduction to Linear Regression
Finding the Connection
Many things in life are connected. The more hours you study, the better your test score tends to be. The more rain a farm gets, the higher its crop yield. Linear regression is a way to measure the strength of these connections.
It helps us model the relationship between two variables: an independent variable (the cause) and a dependent variable (the effect). The independent variable is the one we think influences the other. The dependent variable is what we are trying to predict or explain.
Imagine you have a bunch of data points. For example, you could have the height and weight of many different people. If you plot these points on a graph, you might see a pattern. Linear regression finds the single straight line that best fits through the middle of those data points. This line represents the simplest relationship between the variables.
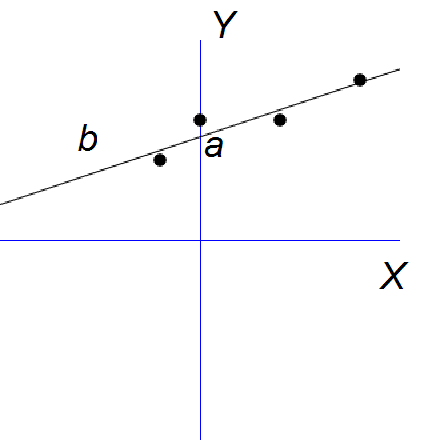
This line doesn't just look nice; it gives us a formula to make predictions. If you know a new person's height, you can use the line to estimate their weight.
The Regression Equation
The line that linear regression finds can be described by a simple mathematical equation. This equation is the core of the model.
Let's break down what each piece means:
- Y is the dependent variable. This is the value we want to predict (e.g., a person's weight).
- X is the independent variable. This is the information we use to make the prediction (e.g., a person's height).
- (beta-zero) is the intercept. It's the value of when is zero. In a graph, it's where the line crosses the vertical Y-axis.
- (beta-one) is the coefficient for X. It represents the slope of the line. It tells us how much changes for every one-unit increase in .
- (epsilon) is the error term. It represents the difference between our model's prediction and the actual data. No model is perfect, and this term captures everything our line doesn't explain.
Interpreting the Pieces
The real power of linear regression comes from understanding the intercept and the coefficient.
Let's use an example: predicting ice cream sales based on the daily temperature. Our model might look like this:
Sales = 50 + 10 * Temperature
Here, the intercept () is 50. This means that if the temperature was 0°C, our model predicts we would sell 50 ice creams. Sometimes, the intercept is just a starting point for the line and doesn't have a practical meaning. For instance, we probably wouldn't be selling ice cream at 0°C anyway.
The coefficient () is 10. This is the interesting part. It tells us that for every 1-degree increase in temperature, we expect to sell 10 more ice creams. A positive coefficient means that as one variable goes up, the other tends to go up too. A negative coefficient would mean the opposite.
The coefficient tells you the direction and strength of the relationship. A large coefficient means the independent variable has a strong effect on the dependent variable.
Where It's Used
Linear regression is simple but incredibly useful, so it appears in many different fields.
- Economics: Economists use it to predict consumer spending based on income, or to see how a change in interest rates might affect unemployment.
- Biology: Biologists can model the relationship between a plant's growth and the amount of sunlight it receives, or how a drug dosage relates to blood pressure.
- Social Sciences: Researchers might analyze how years of education predict future income, or how population density relates to crime rates.
- Business: Companies use it to forecast sales based on their advertising budget or to understand how pricing affects the number of units sold.
In all these cases, linear regression provides a clear, mathematical way to understand how one thing influences another.
Let's check your understanding of these core concepts.
What is the primary goal of linear regression?
A biologist is studying the effect of fertilizer amount on plant height. In this linear regression model, what is the independent variable?
Linear regression is a foundational tool for finding patterns in data and making predictions. By understanding its simple equation, you can start to see the hidden relationships all around you.