Introduction to Graphing
Understanding Graphs
What Is a Graph?
At its heart, a graph is a way to show connections. Think of a simple map of your local subway system. Each station is a point, and the lines connecting them are the routes. In data visualization, we use this same idea to represent relationships between different pieces of information.
A graph is a non-linear data structure made up of vertices (nodes) and edges (connections) that represent relationships between objects.
Graphs have two basic building blocks: nodes and edges.
Node
noun
A point or vertex in a graph. It represents an individual entity or object.
Nodes are the fundamental units of our graph. They could be people, cities, products, or even abstract concepts.
Edge
noun
A line that connects two nodes in a graph. It represents the relationship between them.
Edges are what bring the graph to life, turning a collection of points into a network of connections. Together, nodes and edges allow us to visualize complex systems in a simple, intuitive way.
Types of Graphs
Not all relationships are the same, so we use different types of graphs to represent them accurately. The distinctions usually come down to the characteristics of the edges.
The two main distinctions are whether the edges have a direction and whether they have a weight.
Directed vs. Undirected
An undirected graph has edges that are like two-way streets. If Node A is connected to Node B, then B is also connected to A. A friendship on Facebook is a good example; the connection is mutual.
A directed graph has edges that are one-way streets. The relationship goes from one node to another, but not necessarily back. Think of following someone on Instagram. You might follow them, but they don't have to follow you back. Arrows on the edges show the direction of the relationship.
Weighted vs. Unweighted
In an unweighted graph, the edges simply show that a connection exists. The focus is on the presence or absence of a relationship, not its strength or cost.
A weighted graph adds more information by assigning a numerical value, or "weight," to each edge. This weight can represent anything from distance and time to cost or the strength of a connection. A map showing the travel time between cities is a classic weighted graph.
Putting Graphs to Work
Graphs are incredibly versatile. They help us find patterns and understand structures in data that might otherwise be invisible. Social networks use them to map friendships and suggest connections. GPS navigation uses weighted graphs to find the fastest route from your home to a destination. Streaming services can even use graphs to recommend your next favorite movie by seeing what's connected to the things you already love.
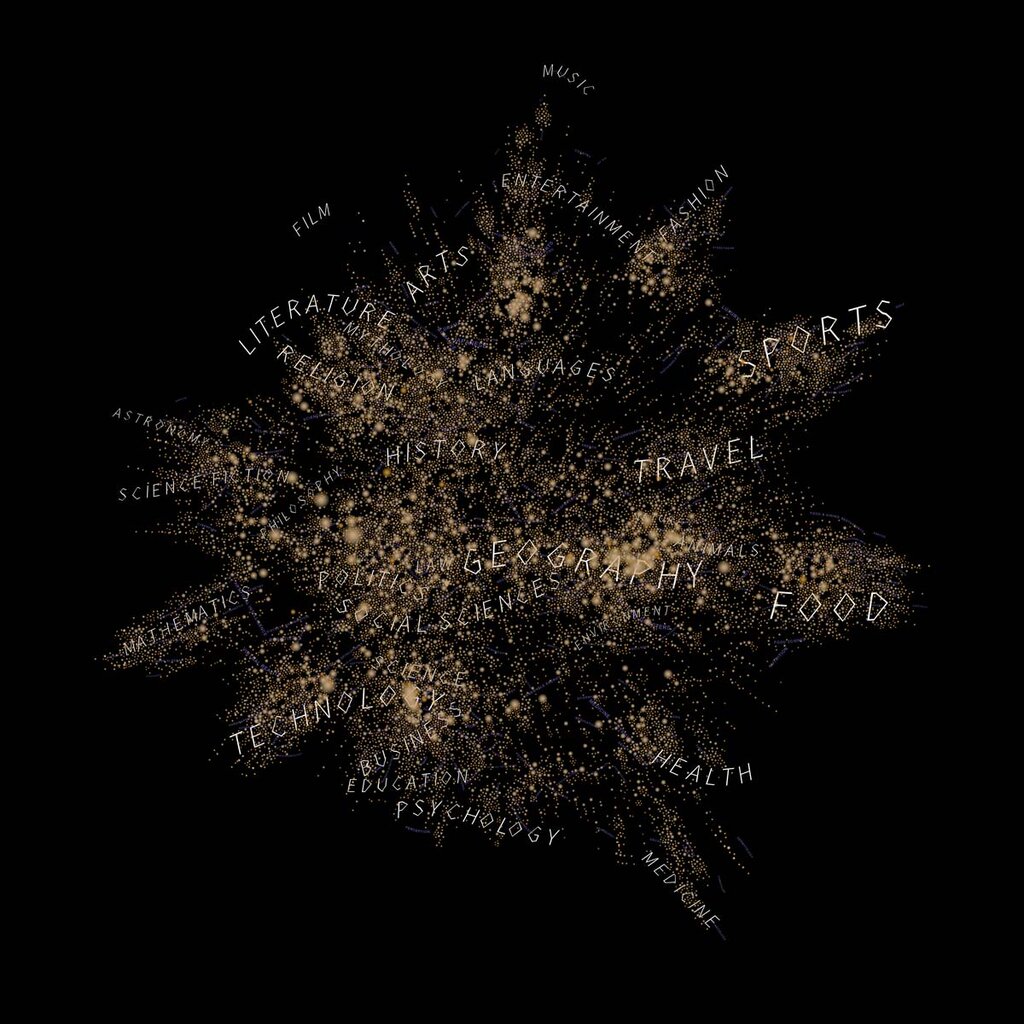
By representing data as a network of nodes and edges, we can uncover the hidden relationships that drive the world around us. This makes graphs one of the most powerful tools for telling stories with data.
Ready to check your understanding?
What are the two fundamental building blocks of a graph used to represent data?
A social media platform where friendships are always mutual (if you are friends with someone, they are automatically friends with you) would be best represented by which type of graph?
Now you have a solid grasp of what graphs are and why they're so useful for visualizing connections in data.