Introduction to GIS
Introduction to GIS
What is GIS?
A Geographic Information System, or GIS, is a powerful tool for working with data tied to a specific location. Think of it as a combination of maps and spreadsheets. Instead of just seeing a list of addresses, a GIS lets you see those addresses on a map, analyze patterns, and understand relationships you might otherwise miss.
The core idea of GIS is to layer different types of information on top of a map. One layer might show roads, another might show buildings, and a third could show elevation.
By combining these layers, we can ask complex questions. Where is the best location for a new park, considering population density, existing parks, and property lines? Which homes are at risk from a potential flood? GIS helps us answer these spatial questions.
The Five Components
A complete GIS is more than just software. It’s a system made up of five key components working together:
- Hardware: This is the computer where the GIS software runs. It can be a powerful desktop workstation, a server, or even a mobile device.
- Software: This provides the tools to work with geographic data. It allows you to view, analyze, and create maps and other spatial information. You might have heard of software like QGIS or ArcGIS.
- Data: The heart of any GIS is its data. This includes maps, satellite images, aerial photos, and tables of information linked to locations.
- People: From the technicians who manage the system to the leaders who use its results to make decisions, people are essential. They design and run the analyses.
- Procedures: These are the methods and workflows used for analysis. A well-designed procedure ensures that results are accurate and repeatable.
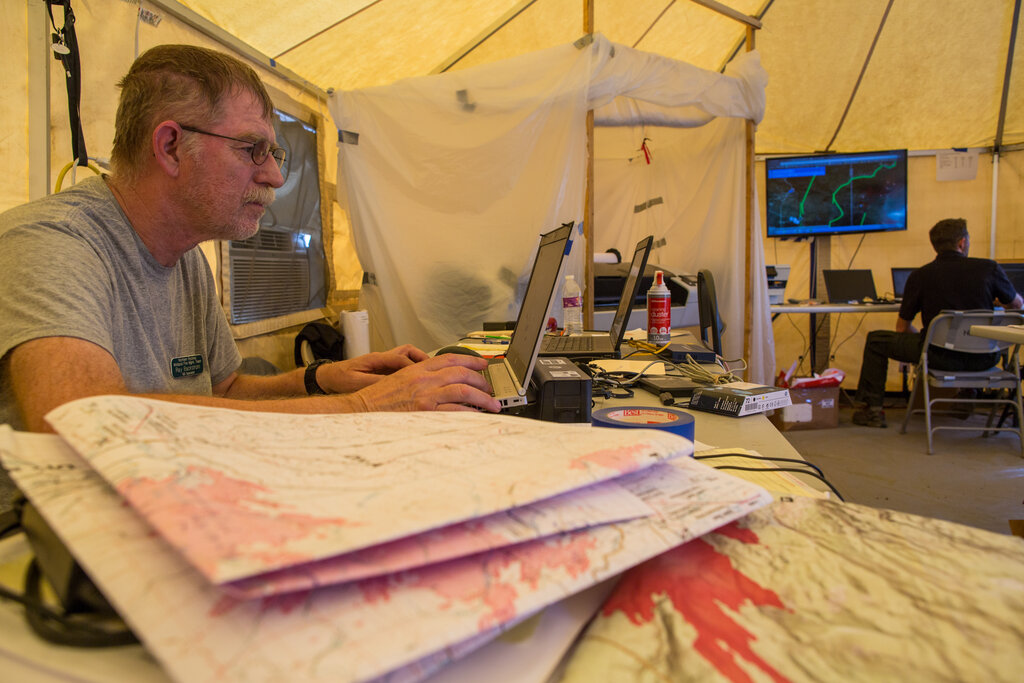
GIS has applications in almost every field. Urban planners use it to manage infrastructure and plan new developments. Environmental scientists use it to track deforestation and model the impact of climate change. Logistics companies use it to optimize delivery routes, saving time and fuel.
Representing the World
How does a GIS actually store geographic information? It uses two primary data models to represent the world: vector and raster.
Choosing the right model depends on what you are trying to represent. Vector is great for distinct boundaries, while raster excels at showing continuous phenomena.
Vector
noun
A data model that uses points, lines, and polygons to represent discrete geographic features. A single house might be a point, a road could be a line, and a park boundary would be a polygon.
Raster
noun
A data model that uses a grid of cells, or pixels, to represent continuous data. Each cell in the grid has a value. Satellite images, elevation maps, and temperature data are common examples of raster data.
Finding Your Place
To be useful, all this data needs a frame of reference. This is where coordinate systems and map projections come in. A coordinate system is a framework used to define the location of points in space. The most well-known is the geographic coordinate system of latitude and longitude, which uses angles to pinpoint locations on our planet's 3D, spherical surface.
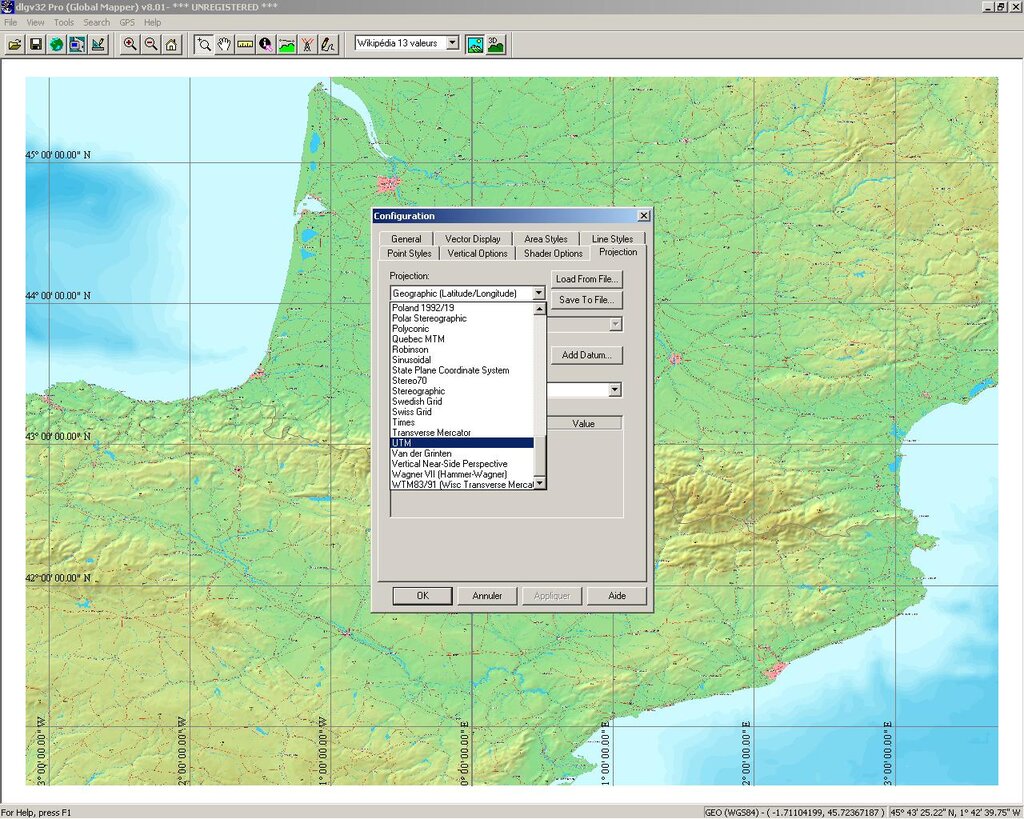
But most of the time, we work with flat maps, not globes. A map projection is a method for taking the curved surface of the Earth and displaying it on a flat surface. Think about trying to flatten an orange peel – you can't do it without stretching or tearing it. The same problem applies to maps.
Every map projection introduces some kind of distortion. Some projections preserve area, others preserve shape, and some are a compromise between different properties. The key is to choose the right projection for the job.
With these foundational concepts—layers, components, data models, and coordinate systems—you now understand the basic principles of how a GIS works.
Ready to check your understanding?
Which of the following is NOT considered one of the five key components of a complete GIS?
A map projection is a method for representing the Earth's 3D, spherical surface on a flat, 2D map.
By understanding how to capture, analyze, and visualize spatial data, we can see the world in a whole new way.