Introduction to Data Analytics
Introduction to Data Analytics
What is Data Analytics?
Data analytics is the science of looking at raw data to find trends and answer questions. Think of it like a detective arriving at a crime scene. The detective gathers clues—fingerprints, footprints, witness statements—and pieces them together to understand what happened. In the world of business, data is the collection of clues, and a data analyst is the detective who makes sense of it all.
The goal is to turn a sea of raw numbers and facts into clear, actionable insights.
Why is this so important? Because it helps organizations make smarter decisions. Instead of guessing what customers want, a company can look at purchase history, website clicks, and survey feedback. A streaming service doesn't randomly suggest movies; it analyzes what you've watched before to predict what you'll enjoy next. This data-driven approach removes guesswork, reduces risk, and helps businesses serve their customers better.
The primary goal of data analytics is to help individuals or organizations to make informed decisions based on patterns, behaviors, trends, preferences, or any type of meaningful data extracted from a collection of data.
The Four Types of Analytics
Data analytics isn't a single activity. It's a spectrum of techniques that build on each other, moving from simple observation to complex prediction. We can break it down into four main types.
| Type | Question It Answers | Example |
|---|---|---|
| Descriptive | What happened? | A sales report showing total revenue for the last quarter. |
| Diagnostic | Why did it happen? | Analyzing the sales report to see that a new marketing campaign drove a 20% increase in revenue. |
| Predictive | What will happen? | Using past sales data to forecast revenue for the next quarter. |
| Prescriptive | What should we do? | Recommending an optimal advertising budget to meet the next quarter's revenue forecast. |
Descriptive analytics is the simplest form. It summarizes past data to explain what happened. It’s like looking in the rearview mirror. This includes things like website traffic reports, sales figures, and social media engagement metrics. It gives you a clear picture of the past but doesn't explain why it looks that way.
Diagnostic analytics takes the next step by digging into the “why.” If descriptive analytics shows that sales dropped in July, diagnostic analytics investigates the cause. Was it a competitor's sale? A problem with your website? A seasonal trend? This type of analysis looks for relationships and causes within the data.
Predictive analytics uses historical data to make educated guesses about the future. It identifies the likelihood of future outcomes based on trends. This is where techniques like machine learning come into play. A retail company might use predictive analytics to forecast which products will be popular during the holiday season, helping them manage inventory.
Finally, prescriptive analytics gives you advice. It takes the predictions and suggests actions to take to achieve a desired goal. If predictive analytics forecasts a drop in customer subscriptions, prescriptive analytics might recommend a specific promotional offer to send to at-risk customers to prevent them from leaving.
From Data to Decisions
The ultimate purpose of data analytics is to guide decision-making. But turning raw data into a smart decision follows a structured path. While the specific tools and techniques can get complex, the overall process is quite logical. It’s a cycle of continuous improvement, not a one-time task.
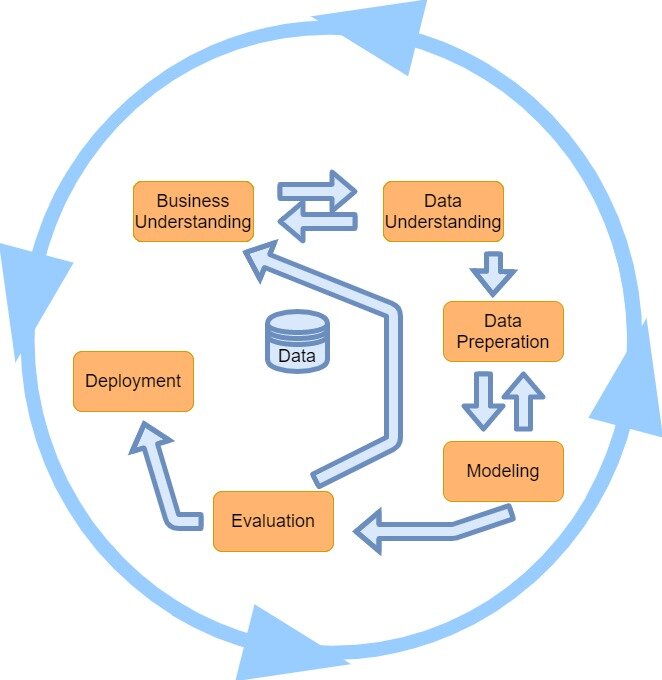
This process generally involves a few key stages:
-
Understanding the Goal: It starts with a clear question. What problem are we trying to solve? Are we trying to increase sales, improve customer satisfaction, or make our operations more efficient?
-
Gathering and Understanding Data: Next, you find and collect the relevant data. This is about knowing what information you need and where to find it.
-
Preparing the Data: Raw data is often messy. It might have missing values, duplicates, or errors. This step involves cleaning and organizing the data so it's ready for analysis.
-
Analysis and Modeling: Here is where the real discovery happens. Analysts use statistical models or machine learning algorithms to find patterns, correlations, and trends.
-
Evaluating the Results: Once you have some findings, you need to check if they make sense. Do the patterns hold up? Do they actually help answer the original question?
-
Taking Action: The final step is to use these insights to make a decision. This could mean launching a new marketing campaign, changing a product's price, or improving a business process. The results of this action then generate new data, and the cycle begins again.
By following a clear process, organizations can systematically turn their data from a jumble of facts into a powerful strategic asset.