Introduction to Data Analytics
Introduction to Data Analytics
What Is Data Analytics?
Data analytics is the process of examining raw data to find trends and answer questions. Think of it as a form of detective work for information. Instead of clues at a crime scene, you're looking for patterns in data. The goal is to turn a sea of numbers and text into clear, actionable insights that help you make smarter decisions.
Every day, we perform a simple version of this. When you check a few weather apps to decide if you should bring an umbrella, you're analyzing data. Businesses do the same, but on a much larger scale. They analyze customer feedback to improve their products, study sales figures to manage inventory, and track website clicks to make their online experience better. In short, data analytics helps replace guesswork with knowledge.
The Data Analytics Lifecycle
Getting from raw data to a useful insight follows a clear path. This journey is often called the data analytics lifecycle, and it consists of a few key stages. While the exact steps can vary, they generally follow a logical sequence.
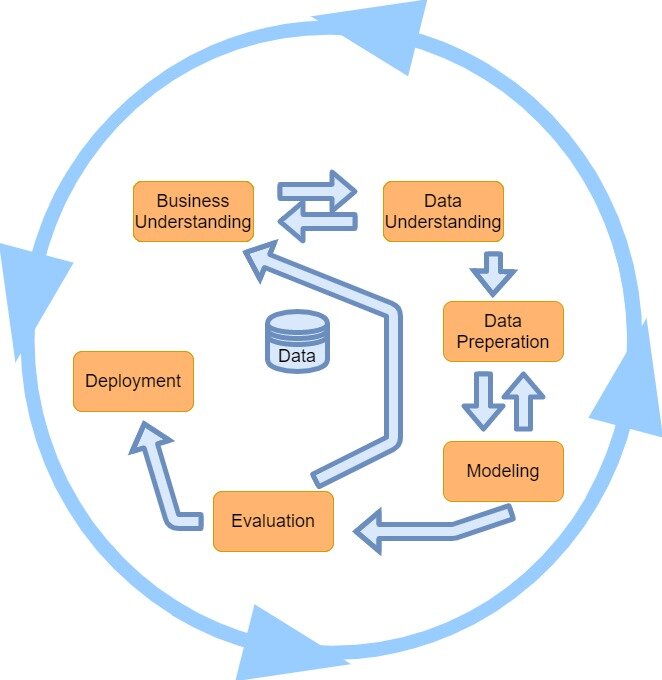
Here's a breakdown of the typical phases:
-
Data Collection: This is where it all begins. Data needs to be gathered from various sources. It could come from customer surveys, sales records, website traffic, social media activity, or even sensors on a factory floor.
-
Data Cleaning: Raw data is almost never perfect. It’s often messy, with errors, missing entries, or inconsistencies. The cleaning phase, also called data preparation, involves fixing these issues. It's a critical step because the quality of your analysis depends entirely on the quality of your data. Think of it as preparing your ingredients before you start cooking.
-
Data Analysis: Once the data is clean, the real investigation begins. In this phase, you explore the data to identify patterns, correlations, and outliers. You might use statistical methods or simply sort and filter the data to see what stands out. This is where you start to find the answers to your questions.
-
Data Visualization and Interpretation: Finding an insight isn't enough; you have to share it with others in a way they can understand. Visualization turns your findings into charts, graphs, and maps. A good visual tells a story, making complex information easy to digest. The final step is to interpret these findings and decide what actions to take based on them.
Roles, Responsibilities, and Rules
A data analyst is the person who guides data through its lifecycle. They are part detective, part storyteller, and part problem-solver. Their main job is to translate numbers into a narrative that can inform business strategy.
Key responsibilities include asking the right questions, collecting and cleaning data, identifying trends, and presenting findings to stakeholders who may not be familiar with the technical details.
This work comes with significant responsibility. Ethical considerations are paramount in data analytics. Data analysts must handle information with care, ensuring they protect individual privacy. They need to be aware of potential biases in the data that could lead to unfair outcomes, such as a hiring algorithm that discriminates against a certain group. Transparency is also key, meaning analysts should be clear about where their data came from and how they arrived at their conclusions. Trust is the foundation of good data analysis.
Ready to check your understanding? Let's see what you've learned about the fundamentals of data analytics.
What is the primary goal of data analytics?
In which phase of the data analytics lifecycle are patterns, correlations, and outliers identified by exploring the data?
Understanding these core concepts is the first step into the world of data. By knowing how to collect, clean, analyze, and interpret data ethically, you can start to uncover the stories hidden within it.