Introduction to Calculus
Functions and Graphs
What is a Function?
Think of a function as a simple machine. You put something in, it does something to it, and something new comes out. For any specific input, you always get the exact same output. A coffee machine is a good analogy. You put in a coffee pod (the input), and you get a cup of coffee (the output). You'll never put in a coffee pod and get tea.
In mathematics, a function is a rule that assigns each input value to exactly one output value. We usually call the input and the output or , which you read as "f of x." The notation just means that the output value depends on the input value .
For example, in the function , the rule is "add two to whatever number you're given." If the input is 3, the output is . If the input is -4, the output is . Each input has only one possible result.
Domain and Range
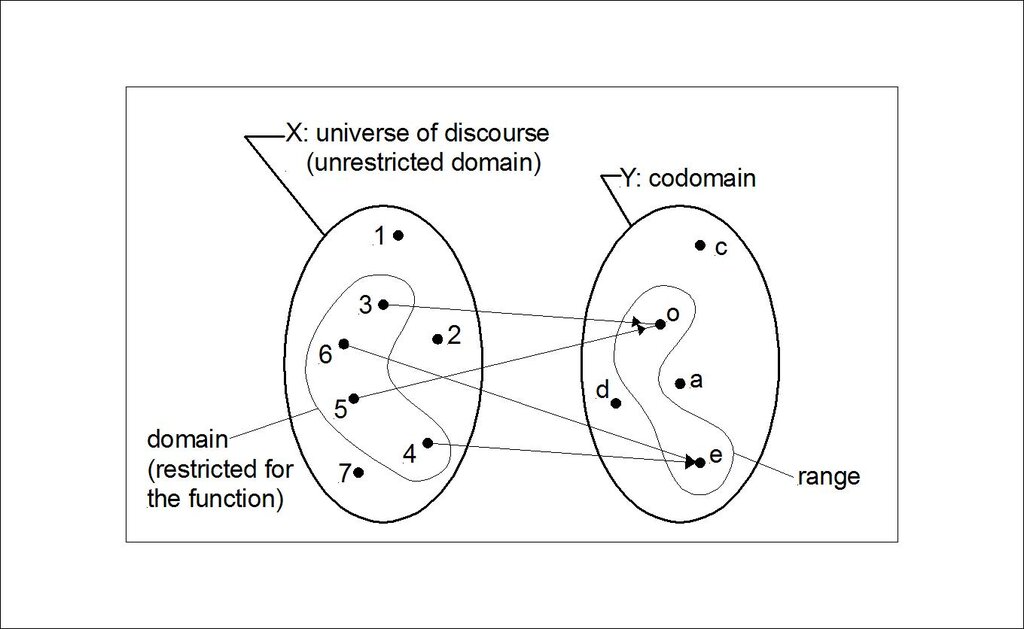
Every function has a set of possible inputs and a resulting set of possible outputs. These sets have special names.
Domain
noun
The set of all possible input values (x-values) for a function.
Range
noun
The set of all possible output values (y-values) for a function.
Let's consider the function . Since we can't take the square root of a negative number (in the set of real numbers), the domain is all non-negative numbers, or . The outputs we get from taking the square root are also never negative, so the range is also all non-negative numbers, or .
A Tour of Common Functions
Functions come in many flavors. Understanding the basic types and what their graphs look like is a key step in mastering calculus. The graph of a function is just a visual representation of its inputs and outputs on a coordinate plane, with inputs on the horizontal x-axis and outputs on the vertical y-axis.
A simple way to check if a graph represents a function is the vertical line test. If you can draw a vertical line anywhere on the graph and it only crosses the curve once, it's a function.
Let's look at some of the most common families of functions.
Linear and Quadratic Functions
The simplest type of function is a linear function. Its graph is a straight line. The general form is , where is the slope (how steep the line is) and is the y-intercept (where the line crosses the vertical axis).
A quadratic function has the form . Its graph is a U-shaped curve called a parabola. If the a term is positive, the parabola opens upwards. If a is negative, it opens downwards.
Linear and quadratic functions are both types of a broader category called polynomial functions. These are built from variables raised to non-negative integer powers, like . Their graphs are smooth, continuous curves without any sharp corners or breaks.
Rational, Exponential, and Logarithmic
A rational function is a ratio of two polynomials, like . A key feature of these graphs is the presence of asymptotes. An asymptote is a line that the graph approaches but never touches. In our example, the input would make the denominator zero, which is undefined. So, the graph has a vertical asymptote at .
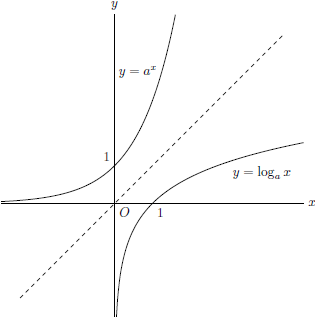
Exponential functions model rapid growth or decay, like compound interest or radioactive decay. They have the form , where the base is a positive constant. If , the graph shoots up quickly. If , it drops quickly.
The inverse of an exponential function is a logarithmic function, written as . It answers the question, "What exponent do I need to raise the base a to in order to get x?" Logarithmic graphs grow very slowly.
Understanding these fundamental function types and their graphs is like learning the alphabet before you start reading. They are the building blocks for the more complex ideas you'll encounter in calculus.
Which statement best describes a mathematical function?
Given the function , what is the value of ?