Interpreting Motion from Non-Linear Position Graphs
Understanding Motion Graphs
Graphs That Tell a Story
A picture is worth a thousand words, and in physics, a graph is worth a thousand data points. Motion graphs are visual tools that tell the story of an object's journey. They show us where something is, how fast it's going, and how its speed is changing, all at a glance. By plotting motion against time, we can see patterns that numbers alone might hide.
We'll look at three main types of motion graphs: position-time, velocity-time, and acceleration-time. Each one gives us a different piece of the puzzle.
Position vs. Time
A position-time graph tracks an object's location over a period of time. The vertical axis (y-axis) represents position, and the horizontal axis (x-axis) represents time. If you walk away from your house in a straight line, this graph would plot your distance from home at every second of your walk.
The key to this graph is its slope. The slope of a position-time graph tells you the object's velocity.
- A steep, upward-sloping line means high positive velocity (moving away fast).
- A shallow, upward-sloping line means low positive velocity (moving away slowly).
- A flat, horizontal line means zero velocity (the object is not moving).
- A downward-sloping line means negative velocity (the object is moving back toward the starting point).
On a position-time graph, the slope is the velocity. A straight line means constant velocity.
Velocity vs. Time
A velocity-time graph shows how an object's velocity changes over time. Now, the vertical axis represents velocity, while the horizontal axis still represents time. This type of graph is incredibly useful for understanding acceleration.
Just as with the position-time graph, the slope tells us something important. The slope of a velocity-time graph is the object's acceleration.
- An upward-sloping line means positive acceleration (speeding up in the positive direction).
- A flat, horizontal line means zero acceleration (constant velocity).
- A downward-sloping line means negative acceleration (slowing down or speeding up in the negative direction).
These graphs also have a second trick. The area under the line on a velocity-time graph represents the object's displacement (the change in position). If the line is below the horizontal axis, the area represents negative displacement.
Putting It All Together
The three types of graphs are deeply connected. A change on one graph is reflected on the others. Let's look at an example of an object with constant, positive acceleration, like a ball dropped from rest.
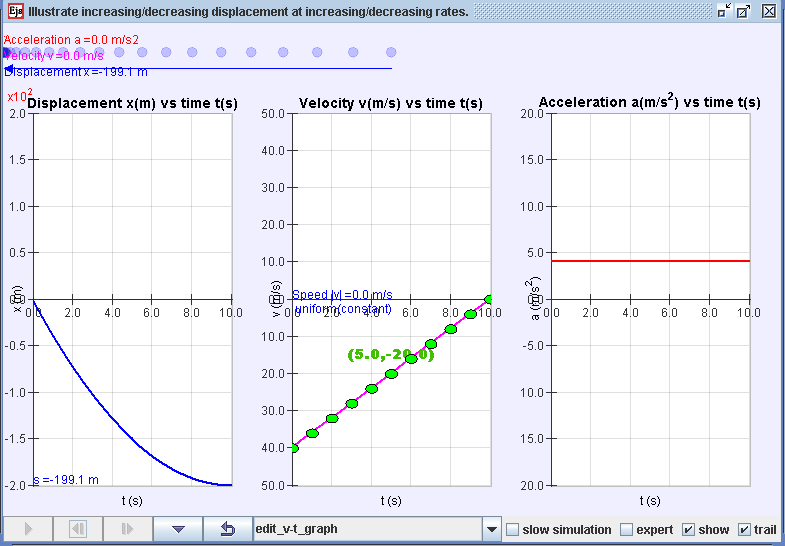
Notice the pattern:
- The acceleration-time graph is a flat, horizontal line in the positive region. This shows acceleration is constant and positive.
- The velocity-time graph is a straight, upward-sloping line. This makes sense, as a constant acceleration means the velocity changes at a steady rate. The slope of this line is the value on the acceleration graph.
- The position-time graph is a curve that gets steeper over time. The object covers more and more distance each second because its velocity is increasing. The slope of this curve at any point is the value on the velocity graph at that same time.
Being able to sketch and interpret these graphs is a fundamental skill in physics. It allows you to visualize and analyze motion without getting bogged down in equations, turning complex scenarios into simple geometric shapes.
Ready to test your understanding?
What does the slope of a position-time graph represent?
On a velocity-time graph, what does a straight, horizontal line located above the x-axis indicate?
By mastering these graphs, you've built a strong foundation for understanding the language of motion.