Interpreting Econometric Regression Results
Regression Model Construction
From Equation to Estimate
In multiple linear regression, we model the relationship between a dependent variable, Y, and several independent variables, X. The goal is to find an equation that best describes how these variables relate to one another. This theoretical relationship is captured by the following formula:
This equation is a blueprint. To make it useful, we need to estimate the actual values for the intercept () and the slope coefficients (, etc.). This is done using a statistical method called Ordinary Least Squares (OLS), which crunches the data and produces a table of results, often called a regression output summary.
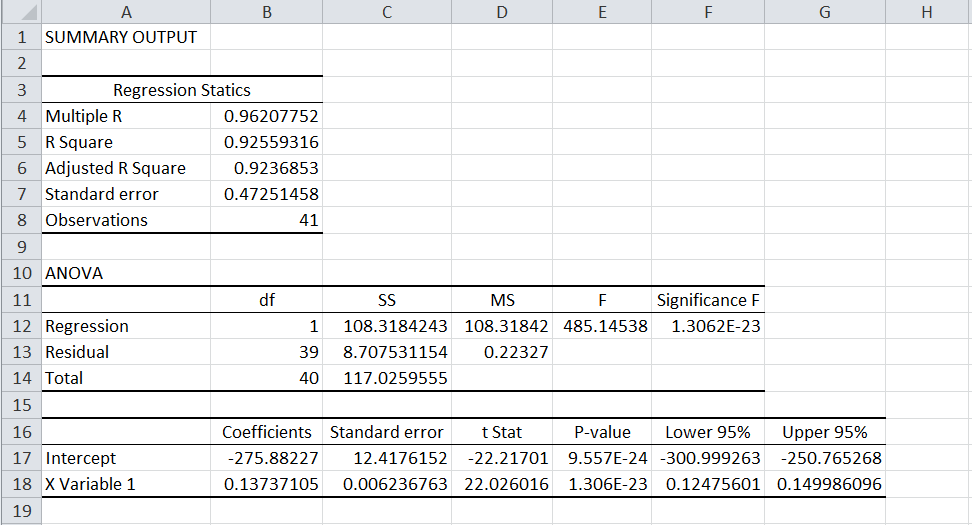
Let's map the equation to this table. The number listed next to 'Intercept' in the 'Coefficients' column is our estimated . It represents the predicted value of our dependent variable when all independent variables in the model are equal to zero. This is our baseline.
The numbers next to each of our predictor variables (like 'X Variable 1') are our estimated slope coefficients, corresponding to , and so on. Each coefficient tells us something very specific, thanks to a crucial assumption: ceteris paribus.
Holding All Else Constant
The Latin phrase means "with other things the same" or "all other things being equal." In regression, it means that each slope coefficient measures the effect of one independent variable on the dependent variable, while holding all other independent variables in the model constant.
For example, the coefficient for tells you how much is expected to change for a one-unit increase in , assuming , , and all other variables in the model do not change.
This is one of the most powerful features of multiple regression. It allows us to isolate the impact of a single factor from a web of interconnected influences. In mathematical terms, each coefficient is a partial derivative.
The sign of the coefficient—positive or negative—tells you the direction of the relationship. A positive coefficient means that as the independent variable increases, the dependent variable also tends to increase. A negative coefficient means that as the independent variable increases, the dependent variable tends to decrease.
| Coefficient Sign | Interpretation (Ceteris Paribus) |
|---|---|
| Positive (+) | A one-unit increase in X is associated with an increase in Y. |
| Negative (-) | A one-unit increase in X is associated with a decrease in Y. |
| Zero (or near zero) | X has little to no linear relationship with Y, after accounting for other variables. |
By matching the coefficients from the OLS output to their place in the regression equation, you build a concrete model that can be used for prediction and interpretation. Each number has a precise meaning, rooted in the principle of holding other factors constant.
In multiple linear regression, what does the principle of ceteris paribus allow an analyst to do?
A regression model is created to predict a car's fuel efficiency (Y, in MPG) based on its weight (X1, in pounds) and engine size (X2, in liters). The coefficient for weight (X1) is -0.005. How should this be interpreted?