Intermediate Forex Trading and Strategy
Technical Chart Patterns
Reading the Narrative of Price
Price charts tell a story. Beyond simple support and resistance lines, recurring shapes and formations reveal the collective psychology of buyers and sellers. These are known as chart patterns, and they act as a roadmap, suggesting where the price might go next. We'll focus on patterns that appear on intermediate timeframes like the 1-hour to 4-hour charts, as they often provide a good balance between signal clarity and trading opportunity.
Patterns generally fall into two categories: reversal and continuation. Reversal patterns suggest a trend is running out of steam and is likely to change direction. Continuation patterns signal a pause in the current trend, after which the original direction is likely to resume.
Reversal Patterns
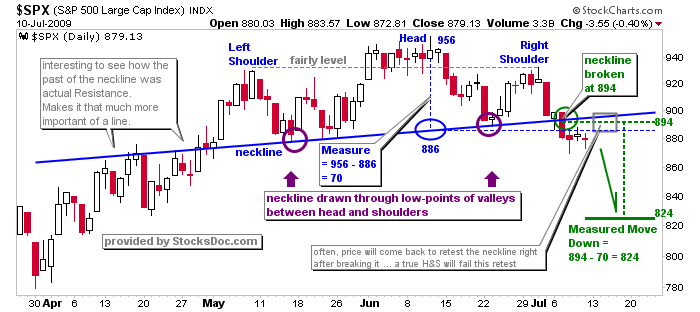
One of the most classic reversal patterns is the Head and Shoulders. It signals a potential end to an uptrend and a shift to a downtrend. The pattern is formed by three peaks:
- Left Shoulder: A price peak followed by a decline.
- Head: A higher peak, followed by another decline.
- Right Shoulder: A lower peak, roughly symmetrical to the left shoulder, followed by a decline.
The troughs of these declines can be connected by a trendline known as the neckline. A break below this line is the classic signal to consider a short position. The logic here is simple: after two failed attempts to push higher (the head and right shoulder), the buying pressure is exhausted. Once the crucial support level—the neckline—gives way, sellers take control.
The inverse Head and Shoulders is the exact opposite. It's a bullish pattern that appears at the bottom of a downtrend and signals a potential reversal upwards. It has three troughs, with the middle one (the head) being the lowest.
Double Tops and Double Bottoms are simpler but equally powerful reversal patterns. A Double Top looks like the letter 'M' and occurs at the end of an uptrend. The price hits a resistance level, pulls back, and then tries to break that same resistance level again but fails. This second failure shows that buyers lack the conviction to push prices higher. A break below the low point between the two peaks confirms the pattern.
A Double Bottom is the inverse, looking like a 'W' at the end of a downtrend. The price finds a support level, bounces, falls back to test that same support, and bounces again. The inability to break the support level twice indicates selling pressure is waning, and buyers are stepping in.
Continuation Patterns
Continuation patterns signal a temporary pause in a strong trend. Think of them as the market catching its breath before continuing in the same direction. Two of the most common are Flags and Triangles.
A forms during a sharp uptrend. It begins with a strong upward move, called the 'flagpole'. This is followed by a period of slight downward consolidation, forming a small rectangular or parallelogram shape—the 'flag'. This consolidation shows some profit-taking, but not enough to reverse the trend. A breakout above the flag's upper resistance line signals the continuation of the uptrend. A Bear Flag is the mirror image, occurring in a downtrend.
A good way to estimate the target for a flag pattern is to measure the height of the flagpole and project that distance upward from the point of the breakout.
Triangles are another key continuation pattern. They represent a period of tightening consolidation where buyers and sellers reach a temporary equilibrium before one side gives way.
-
Symmetrical Triangle: Formed by two converging trendlines, one descending and one ascending. It indicates indecision, and the price could break out in either direction, though it often continues the preceding trend.
-
Ascending Triangle: Characterized by a flat horizontal resistance line and a rising support line. This is a bullish pattern. It shows that while there is strong resistance at a certain price, buyers are becoming progressively more aggressive, making higher lows. A breakout above the resistance is the buy signal.
-
Descending Triangle: The bearish counterpart. It has a flat support line and a falling resistance line, indicating sellers are making lower highs. A break below support signals a likely continuation of the downtrend.
Breakouts and Traps
Identifying a pattern is only half the battle. The real challenge is confirming the breakout. A true breakout should ideally occur with a noticeable increase in trading volume, showing conviction behind the move. After the initial break, the price will often pull back to retest the broken level (the former neckline, resistance, or support line). A successful retest, where the old resistance becomes new support (or vice-versa), is a strong confirmation that the pattern is valid.
But sometimes, a breakout is a trap. A occurs when the price breaks through a key level but quickly reverses, trapping traders who entered on the initial move. This is often called a 'false breakout' or a bull/bear trap. A key way to avoid these is to wait for confirmation. Instead of entering the moment the price crosses the line, wait for the candle on your chosen timeframe (e.g., 1H or 4H) to close beyond the breakout level. This reduces the chance of being caught by a momentary price spike that doesn't hold.
Chart patterns can be used to predict the direction of prices, areas of support or resistance and price breakout and breakdown points.
Recognizing these patterns takes practice. It’s less about finding perfect, textbook examples and more about understanding the story the price action is telling you about the battle between buyers and sellers.
Ready to test your knowledge?
Which of the following best describes the function of a continuation pattern like a Bull Flag or a Triangle?
Which chart pattern is characterized by three peaks, with the middle peak being the highest, suggesting a potential end to an uptrend?
By combining pattern recognition with an understanding of breakouts and potential traps, you can begin to make more informed trading decisions based on the narratives playing out on the charts.