Integrating AI and BI Platforms
Introduction to Business Intelligence
What is Business Intelligence?
Business Intelligence, or BI, is the process of turning raw data into useful information that helps people make smarter decisions. Think of a restaurant chef. They start with raw ingredients like vegetables, spices, and meat. On their own, these items aren't a meal. But the chef uses their skills and tools to chop, cook, and combine them into a finished dish. BI does something similar for businesses. It takes raw data, like sales numbers, customer feedback, and website clicks, and transforms it into actionable insights.
The goal isn't just to collect data, but to understand what it's telling you. BI helps businesses move from asking "What happened?" to understanding "Why did it happen?" and "What should we do next?"
Without BI, a company is flying blind. They might know they sold 1,000 widgets last month, but they won't know who bought them, which marketing campaign worked best, or whether they're likely to sell more or less next month. With BI, they can answer those questions and plan their strategy accordingly. It replaces guesswork with data-driven facts, leading to better planning, more efficient operations, and a clearer path forward.
The main intention of the BI is to enhance the employees' knowledge with information that allows them to make decisions to achieve its organisational strategies.
The Building Blocks of BI
A BI system isn't just one piece of software; it's a combination of technologies and processes working together. The main components handle everything from storing data to presenting the final insights.
Here's a breakdown of the core parts:
-
Data Warehousing: A data warehouse is a large, centralized repository where a company stores all its historical data from different sources. The key is that this data is cleaned, organized, and structured in a consistent way. It’s like a well-organized library where every book is in its proper place, making it easy for analysts to find what they need.
-
Data Mining: This is the process of sifting through the data warehouse to find hidden patterns, anomalies, and correlations. It’s like a detective looking for clues the average person might miss. Data mining might reveal that customers who buy product A are also very likely to buy product B, an insight that can shape marketing strategy.
-
Analytics: While data mining is about discovery, analytics is about answering specific questions. This can be descriptive (What were our sales in the last quarter?), predictive (What are our sales likely to be next quarter?), or prescriptive (What should we do to increase sales?).
-
Reporting: This is the final step, where insights are presented to decision-makers. Instead of raw spreadsheets, BI uses dashboards, charts, and graphs to visualize the information. A good report tells a clear story, allowing someone to understand complex data at a glance.
The BI Lifecycle
Getting from raw data to a strategic decision follows a cyclical process. It’s not a one-time project but an ongoing effort to continuously learn and improve.
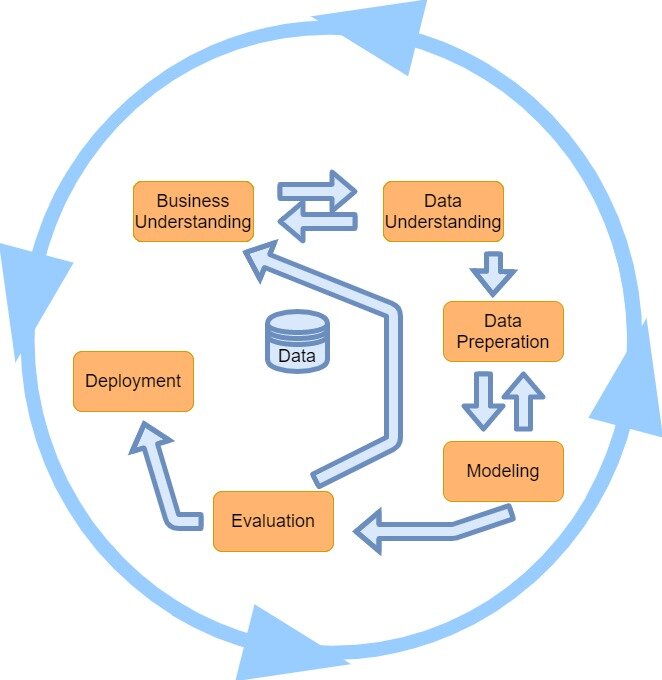
The lifecycle generally includes these key phases:
-
Data Collection: It all starts with gathering data. This comes from internal sources like sales systems (CRM), financial software, and supply chain logs, as well as external sources like social media, market research reports, and competitor analysis.
-
Data Integration and Preparation: Raw data is often messy, inconsistent, and stored in different formats. In this phase, data is cleaned, duplicates are removed, and everything is combined into a unified view within the data warehouse. This is often the most time-consuming part of BI, but it's critical for accurate results.
-
Analysis and Modeling: This is where the core work of data mining and analytics happens. Analysts use statistical models and queries to explore the prepared data, test hypotheses, and uncover insights that address specific business questions.
-
Visualization and Reporting: The findings from the analysis phase are translated into visual formats. Interactive dashboards allow leaders to explore the data themselves, filtering by region, time period, or product line. The goal is to make the insights accessible and understandable to everyone, not just data experts.
This cycle is continuous. The decisions made based on BI reports generate new data and new questions, which feeds back into the start of the process, creating a loop of constant refinement and improvement.
Let's put it into practice. An online retailer might use BI to analyze customer purchase history. They discover a segment of customers who buy running shoes also tends to buy protein bars a week later. Using this insight, they can create an automated email campaign offering a discount on protein bars to anyone who just bought shoes. This is a strategic decision, born from data, that directly supports the business objective of increasing sales.
What is the primary purpose of Business Intelligence (BI)?
In the context of BI, which component is responsible for sifting through large datasets to find hidden patterns, anomalies, and correlations?
Ultimately, Business Intelligence closes the gap between having data and using it effectively. It provides the framework for turning numbers into knowledge and knowledge into confident, strategic action.