Insurance Dashboard Development
Introduction to Insurance Dashboards
What Is an Insurance Dashboard?
Think of the dashboard in your car. It doesn't show you every single mechanical detail. Instead, it gives you the most important information at a glance: your speed, fuel level, and engine temperature. An insurance dashboard does the same thing for an insurance company.
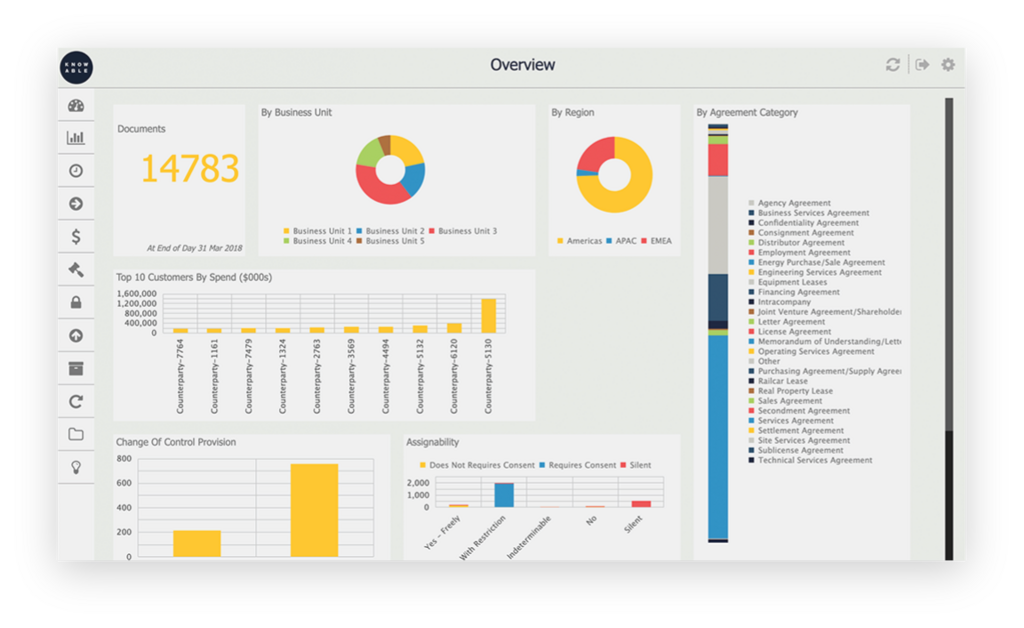
It's a visual tool that pulls data from many different sources and displays it in one place. Instead of sifting through massive spreadsheets, managers can look at a dashboard to see charts and graphs summarizing key performance indicators (KPIs). A KPI is a measurable value that shows how effectively a company is achieving its main business objectives.
Why Use a Dashboard?
Dashboards turn raw data into actionable insights. For an insurance company, this translates into several major benefits.
First, they lead to better decision-making. When leaders have real-time access to metrics like claim processing times or new policy sales, they can spot trends and make informed choices quickly. They don't have to wait for a weekly or monthly report.
Second, they improve operational efficiency. A dashboard might reveal a bottleneck in the claims department where certain types of claims are taking too long to resolve. By identifying the problem visually, the company can take steps to fix it and make the process smoother.
Finally, dashboards can lead to better customer service. By analyzing customer data, an insurer might learn which demographics are buying certain policies or identify common reasons why customers are leaving. This information helps them tailor their products and improve customer satisfaction.
The main goal of a dashboard is to summarize key information so you can understand it at a glance.
Inside an Insurance Dashboard
While dashboards can be customized, most in the insurance industry track similar core areas. Here are a few common components you'd find.
| Component | What It Tracks |
|---|---|
| Policy Management | Monitors the entire lifecycle of policies. This includes the number of new policies sold, renewal rates, and cancellation rates. It helps the company understand its growth and customer loyalty. |
| Claims Processing | Follows claims from the moment they're filed to when they're paid out. KPIs might include the average time to settle a claim, the number of open claims, and the cost per claim. |
| Customer Analytics | Focuses on understanding the customer base. This can include demographic data, customer satisfaction scores, and profitability per customer. It helps with marketing and product development. |
By bringing these elements together, a dashboard gives a holistic view of the business, helping everyone from executives to claims adjusters do their jobs more effectively. Now, let's test what you've learned.
What is the primary purpose of an insurance dashboard?
A measurable value that shows how effectively a company is achieving its main business objectives is known as a ________.
Dashboards provide a powerful way for insurance companies to monitor their health, identify opportunities, and serve their customers better.