Institutional Trading: Integrating Fundamentals with Technicals
Macroeconomic Indicators Overview
Beyond the Charts
You can read a chart like a book. You see the patterns, the momentum shifts, and the key levels where battles are won and lost. But the forces that draw those lines on the screen often originate far from the trading pits. They come from macroeconomic data, the fundamental heartbeat of a nation's economy.
Understanding these indicators provides the narrative behind the price action. It helps you form a directional bias, turning your technical setups from hopeful guesses into high-probability trades. We'll explore the key data points that move markets, not to replace your charts, but to add a powerful layer of context to them.
The Economy's Report Card: GDP
Gross Domestic Product, or GDP, is the broadest measure of a country's economic health. It represents the total monetary value of all goods and services produced over a specific time period. Think of it as the economy's top-line revenue number.
Traders rarely focus on the absolute dollar value. Instead, the key metric is the growth rate, usually reported quarterly and annually. A higher-than-expected GDP growth rate signals a strong, expanding economy. This is typically bullish for that country's currency and its stock market, as it implies higher corporate profits and consumer spending.
GDP is calculated using the expenditure approach:
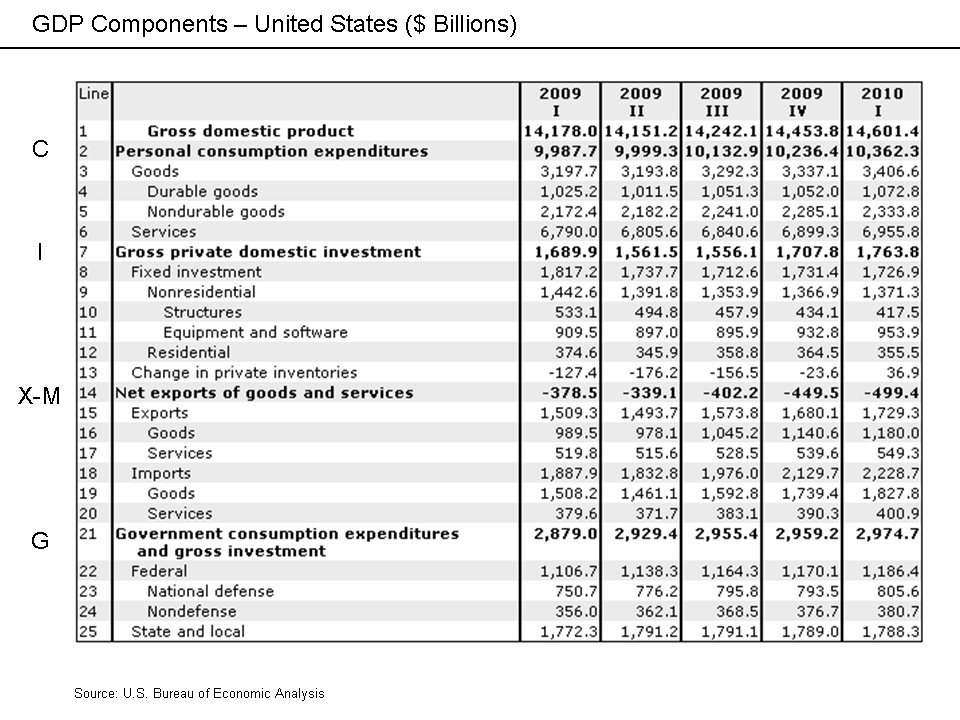
GDP data is a lagging indicator since it reports on past activity. However, its release can still cause significant volatility, especially if it deviates sharply from analyst consensus. Revisions to previous reports are also closely watched, as they can alter the prevailing economic narrative.
Inflation Gauges
Inflation is the rate at which the general level of prices for goods and services is rising, and subsequently, purchasing power is falling. Central banks are obsessed with it, and so are traders. High inflation forces central banks to consider raising interest rates to cool the economy, a move that has profound effects on currency and equity valuations.
Three key reports tell the inflation story:
| Indicator | What It Measures | Market Significance |
|---|---|---|
| CPI (Consumer Price Index) | The average change in prices paid by urban consumers for a basket of consumer goods and services. | The most widely followed inflation report. A high reading pressures central banks to tighten policy. |
| PPI (Producer Price Index) | The average change in selling prices received by domestic producers for their output. | A leading indicator for CPI. If producers are paying more, they'll likely pass those costs to consumers. |
| PCE (Personal Consumption Expenditures) | The change in prices of goods and services consumed by all households. | The Federal Reserve's preferred inflation gauge. It's broader than CPI and accounts for substitution effects. |
Always look for the "core" reading of these reports, which excludes volatile food and energy prices. Core inflation gives a clearer picture of the underlying price trend. An unexpected jump in core CPI or PCE can send currencies soaring and equities tumbling as the market prices in a more aggressive central bank.
The Job Market's Pulse
Employment data is arguably the most market-moving economic release, particularly in the United States. A strong labor market means consumers have money to spend, driving economic growth. It also signals potential wage inflation, a key concern for central bankers.
The most important release is the U.S. Non-Farm Payrolls report, typically released on the first Friday of each month. It has three critical components:
- The Headline Number: The net change in jobs created in the non-agricultural sector.
- The Unemployment Rate: The percentage of the labor force that is jobless.
- Average Hourly Earnings: Measures the growth in wages, a direct input into inflation.
A strong NFP report with rising wages is a classic sign of economic strength, often leading to a stronger U.S. dollar and a mixed-to-negative reaction from stocks, which fear the interest rate hikes that may follow.
Gauging Business and Consumer Health
Beyond the headline numbers of GDP, inflation, and jobs, several other indicators provide a real-time pulse on the economy. These are often survey-based and can give you a forward-looking perspective.
Retail Sales measures consumer spending directly. Because consumption is such a large part of GDP, this report is a vital checkup on the economy's primary engine. Stronger-than-expected sales are bullish for the currency.
Consumer Sentiment indicators, like the University of Michigan Consumer Sentiment Index, survey households about their financial health and economic outlook. A confident consumer is more likely to spend, while a worried consumer will save. This acts as a leading indicator for future consumption trends.
For businesses, the most important surveys are the Purchasing Managers' Indexes (PMIs).
The is a diffusion index based on surveys of purchasing managers in the manufacturing and services sectors. A reading above 50 indicates expansion in the sector, while a reading below 50 indicates contraction. The further the number is from 50, the stronger the rate of change. These are crucial leading indicators because businesses adjust purchasing and hiring plans well before the results show up in GDP or employment data.
Time to test your knowledge of these crucial economic reports.
When analyzing a Gross Domestic Product (GDP) report, what do traders and economists typically focus on the most?
Why do analysts often pay close attention to the "core" reading of inflation reports like the CPI?
By layering these fundamental insights onto your technical analysis, you can build a more robust and nuanced view of the market. You'll start to see not just what is happening on the chart, but why it's happening.