Industrial Weighted Moving Average Explained
Introduction to Moving Averages
Smoothing Out the Noise
Stock prices rarely move in a straight line. They zig and zag, creating a lot of short-term noise that can make it hard to see the bigger picture. Is the price generally heading up, down, or sideways? A moving average helps answer this by smoothing out the price data to reveal the underlying trend.
Think of it like drawing a smooth curve through a set of scattered points on a graph. The curve gives you a better sense of the overall direction than any single point does.
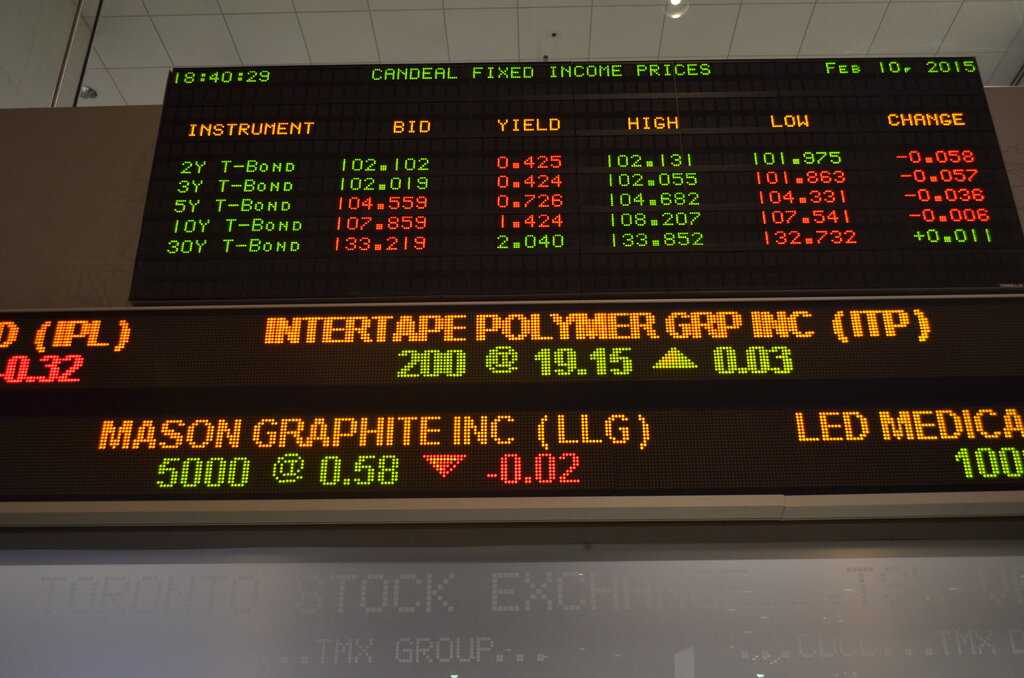
A moving average is a constantly updated average price calculated over a specific number of time periods. As new data becomes available, the oldest data point is dropped, and the new one is added, causing the average to “move” over time. This technique is a cornerstone of technical analysis, helping traders identify trend direction and potential support or resistance levels.
The Simple Moving Average (SMA)
The most straightforward type is the Simple Moving Average, or SMA. It’s calculated by adding up the closing prices for a set number of periods and then dividing by that number of periods. For example, a 10-day SMA is the sum of the closing prices for the last 10 days, divided by 10.
Here, is the price for a period, and is the total number of periods. The key feature of an SMA is that it gives equal weight to every price in the dataset. The price from 10 days ago matters just as much as the price from yesterday. This makes the SMA a stable, smooth line, but it also means it can be slow to react to recent, sudden price changes.
Giving More Weight to Today
What if recent price action is more important than older data? This is the idea behind the Weighted Moving Average (WMA) and the Exponential Moving Average (EMA). Both methods give more significance to the most recent data points, making them more responsive to new information than the SMA.
The WMA and EMA are designed to reduce the lag found in the SMA by emphasizing what's happening in the market now.
The Weighted Moving Average (WMA) assigns a specific weight to each period. The most recent period gets the highest weight, the second most recent gets a slightly lower weight, and so on, down to the first period in the set, which gets the lowest weight. The sum of the weights must equal 1 (or 100%). For a 5-day WMA, for instance, today's price might get a weight of 5, yesterday's a weight of 4, and so on.
The Exponential Moving Average (EMA) also gives more weight to recent prices, but the calculation is a bit more nuanced. The EMA for today depends on the EMA from yesterday, creating a cumulative effect. It uses a smoothing factor, often expressed as a percentage, to determine how much weight is given to the current price. A key difference is that an EMA technically includes all past price data in its calculation, though the influence of older data drops off exponentially over time. This makes it even more responsive to recent price shifts than a WMA.
Choosing the Right Average
There's no single "best" moving average. The choice between SMA, WMA, and EMA depends on the goal. An SMA is useful for identifying long-term, stable trends because it filters out more of the daily noise. An EMA or WMA is better suited for shorter-term trading, where reacting quickly to price changes is more important.
| Moving Average | Key Characteristic | Best For... |
|---|---|---|
| SMA | Equal weighting | Identifying long-term, stable trends |
| WMA | Linear weighting | Medium-term trend analysis |
| EMA | Exponential weighting | Short-term trading; quick reaction |
Understanding these foundational moving averages is the first step. They provide a simple yet powerful way to make sense of price movements and build a framework for analyzing market trends.
Ready to test your knowledge? Let's see what you've learned about the different types of moving averages.
What is the primary purpose of using a moving average in technical analysis?
Which moving average is designed to react most quickly to recent price changes?
By mastering these basic averages, you've built a solid foundation for understanding more complex technical indicators.