HubSpot Reporting Essentials
Introduction to HubSpot Reporting
Making Sense of Your Data
HubSpot is more than just a place to store information about your customers, leads, and website visitors. It’s a powerful engine for understanding what all that information actually means. This is where reporting comes in. Think of it as the process of turning raw data points—like a website visit or a sales call—into a clear story about your business.
Without reporting, you're flying blind. You might be spending money on ads without knowing if they're bringing in customers, or your sales team could be focusing on the wrong leads. Reports are the tools that shine a light on what's working and, just as importantly, what isn't.
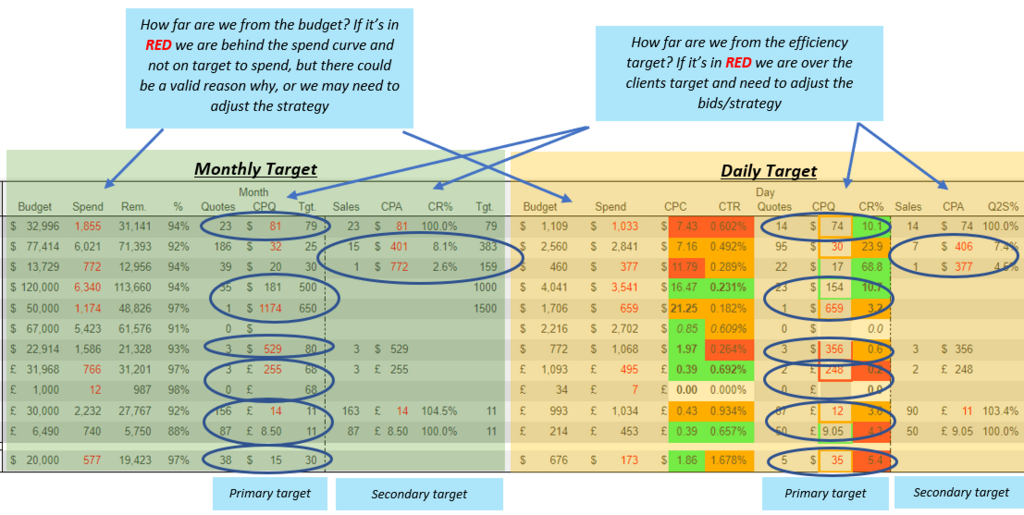
Effective reporting helps you make informed decisions instead of relying on guesswork.
Your Reporting Toolkit
HubSpot comes equipped with a library of pre-built reports. You don't need to be a data scientist to get started. These reports are designed to answer the most common questions that marketing and sales teams have.
| Report Category | Common Questions It Answers |
|---|---|
| Traffic Analytics | Where do my website visitors come from? Which pages are most popular? |
| Campaign Reports | How did my latest email promotion perform? Are my social media ads generating leads? |
| Sales Reports | How many deals did my team close this month? How long does it take to turn a lead into a customer? |
| Contact Reports | How many new contacts did we get this week? Which sources bring in the most valuable leads? |
Each of these report types provides a different lens through which to view your performance. By looking at them together, you can get a complete picture of your customer's journey, from their first visit to your website to the final sale.
Finding Your Way Around
Accessing your reports in HubSpot is straightforward. You'll typically find a main "Reports" or "Analytics Tools" section in your navigation menu. When you click it, you’ll land on your reporting dashboard.
This dashboard is your command center. It’s a customizable space where you can pin your most important reports for a quick, at-a-glance view of your key performance indicators (KPIs). You can think of it as your daily health check-up for your marketing and sales efforts. From here, you can also explore the full library of available reports or start building new ones.
Having these reports in one dashboard allows teams to monitor CRM health in real time, automate data cleanup processes, and ensure that sales and marketing are always working with the most accurate information.
This foundational understanding of what reports are available and where to find them is the first step. By regularly checking your reports, you build a habit of data-driven decision-making that will strengthen your entire business strategy.