GraphRAG vs RAG Explained
Introduction to Knowledge Graphs
The Web of Knowledge
Think about how you know things. You don't just have a list of isolated facts in your head. Instead, your knowledge is a web of connections. You know that Paris is a city, it's located in France, and it's famous for the Eiffel Tower. Each piece of information connects to others, creating a rich tapestry of understanding.
A knowledge graph tries to mimic this web-like structure for computers. It's a way of organizing information that focuses on the relationships between things, not just the things themselves. Instead of a simple database table, imagine a dynamic map of facts where everything is linked.
Knowledge Graph
noun
A model for storing information that uses nodes to represent entities (like people, places, or concepts) and edges to represent the relationships between them.
The two core components of any knowledge graph are entities and relationships.
Entities are the individual objects or concepts. Think of them as the nouns. They are the 'nodes' in the graph. In our example, 'Leonardo da Vinci', the 'Mona Lisa', and the 'Louvre Museum' are all entities.
Relationships are the connections that link these entities together. They are the verbs that describe how the nouns interact. These are the 'edges' of the graph. For instance, Leonardo da Vinci painted the Mona Lisa. The Mona Lisa is located in the Louvre Museum. These connections are what give the data meaning.
This structure is powerful because it captures semantic information. Semantics is the study of meaning. A knowledge graph doesn't just know that two things are related; it knows how they're related. A computer can traverse this graph to make logical inferences. For example, by following the links, a system could answer the question, "Who painted the artwork housed in the Louvre?" without ever being explicitly told the answer. It connects the dots on its own.
Knowledge graphs turn data into knowledge by focusing on the context and connections between facts.
Putting Knowledge to Work
This ability to understand relationships makes knowledge graphs incredibly useful in many different areas. You probably interact with them every day without realizing it.
When you search on Google for a movie, that box on the right-hand side with the cast, director, and reviews? That's powered by a knowledge graph. It pulls together connected entities to give you a complete picture.
E-commerce and streaming sites use them for recommendations. By understanding the relationships between products you've bought or shows you've watched (e.g., same genre, same actors, often bought together), they can suggest what you might like next. In science and medicine, researchers use knowledge graphs to find hidden connections in data, helping to discover new drug applications by linking genes, proteins, and diseases.
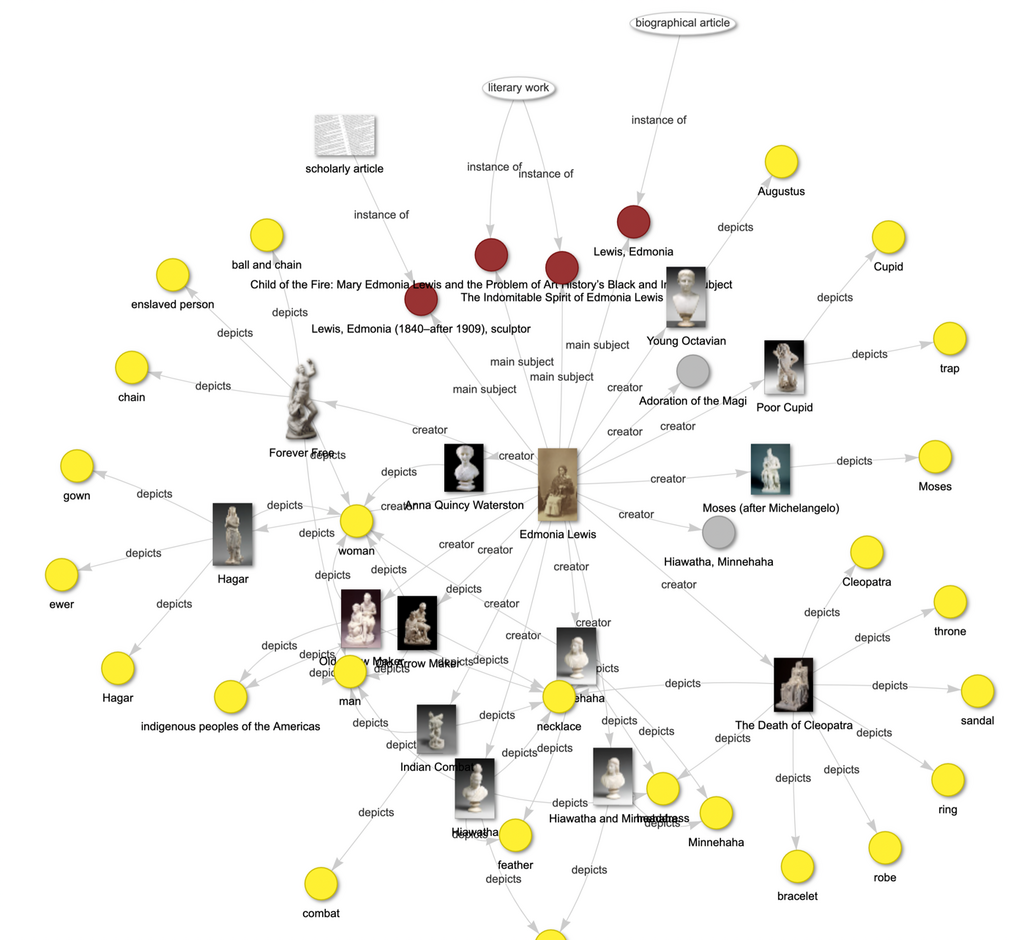
These graphs can be built by extracting information from structured sources like databases or by using natural language processing (NLP) to read and understand unstructured text from websites and documents. The goal is always the same: to create a rich, interconnected model of a domain of knowledge that a machine can reason with.
Time to check your understanding of these core concepts.
What are the two core components that make up a knowledge graph?
In the sentence 'Leonardo da Vinci painted the Mona Lisa', which part represents the 'entity'?
By representing information as a web of relationships, knowledge graphs provide the context that computers need to understand the world a little more like we do.