Google Sheets KPI Dashboard
Introduction to Google Sheets
Welcome to Google Sheets
Google Sheets is a spreadsheet program that lives in your web browser. Think of it like a digital piece of graph paper, but with superpowers. You don't need to install any software, and your work is automatically saved as you go. Best of all, you can easily share your sheets with others to collaborate in real-time.
We'll use Sheets to organize information, perform calculations, and eventually build interactive dashboards. First, let's get comfortable with the basic layout.
Finding Your Way Around
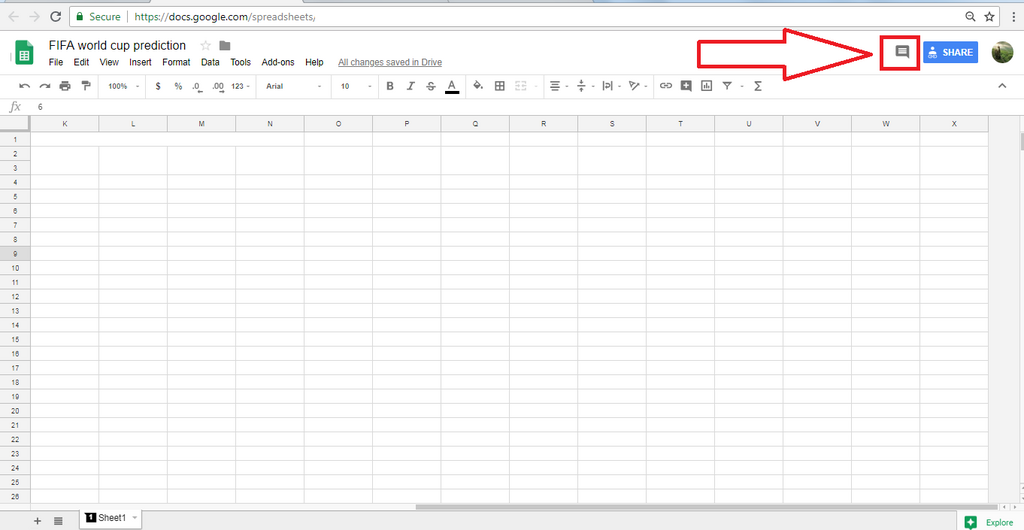
When you open a new sheet, you'll see a large grid of empty boxes. This is your canvas. Above the grid, you'll find a few key areas.
- Menu Bar: At the very top, you'll see words like "File," "Edit," and "View." This is where you can find all the available actions, from saving a copy to inserting charts.
- Toolbar: Below the menu, there's a row of icons. These are shortcuts for common tasks like changing text to bold, adjusting alignment, or adding borders.
- Formula Bar: This long bar, often marked with an symbol, shows you the content of the currently selected box. It's where you'll enter and edit formulas later on.
The Building Blocks
Every spreadsheet is built from three simple parts: columns, rows, and cells.
- Columns run vertically and are labeled with letters (A, B, C...).
- Rows run horizontally and are labeled with numbers (1, 2, 3...).
- A Cell is any single box where a column and a row intersect.
Each cell has a unique address, or reference, based on its column and row. The cell in the top-left corner is A1. The cell to its right is B1, and the one below it is A2. Think of it like a map grid or a game of Battleship. This address system is crucial for telling Sheets which data you want to work with.
Data Entry and Formatting
Getting data into Sheets is easy. Just click on a cell and start typing. You can enter text, numbers, dates, or currency. When you're done, press Enter to move to the cell below or Tab to move to the cell on the right.
Need to fix a typo? Double-click the cell or click it once and then edit the content in the formula bar.
Raw data can be hard to read. Basic formatting helps your spreadsheet look clean and professional. You can change the font, size, color, and alignment using the icons in the toolbar. Try making your column headers bold or adding a background color to your totals to make them stand out.
| Icon | Name | What it does |
|---|---|---|
| B | Bold | Makes text thicker and darker |
| I | Italic | Slants text to the right |
| 🎨 | Fill color | Changes a cell's background color |
| A | Text color | Changes the color of the text itself |
| ≡ | Align | Adjusts text to be left, center, or right aligned |
Let's try creating a simple table. Imagine you're tracking daily expenses. You could set up columns for the item, its category, and how much it cost.
| Item | Category | Amount |
|---|---|---|
| Coffee | Food & Drink | $4.50 |
| Bus Fare | Transportation | $2.75 |
| Sandwich | Food & Drink | $9.25 |
| Notebook | Supplies | $3.00 |
By organizing data this way, you're setting the stage for more powerful analysis later. You could easily sort by category or calculate your total spending.
What is the unique address of the cell at the intersection of the third column and the fifth row?
Which part of the Google Sheets interface contains shortcuts for common tasks like changing text to bold or adjusting alignment?
That's it for the basics. With just these simple concepts, you're ready to start organizing your own data in Google Sheets.