Generative Deep Learning in Earth and Space Sciences
Geophysical Data Preprocessing
Beyond JPEGs
When working with geophysical data, you're not dealing with simple JPEGs or PNGs. The datasets from seismology and astronomy are packed in specialized formats designed to hold much more than just pixel values. They bundle complex, high-dimensional data with critical metadata about how, when, and where it was collected. The two most common formats you'll encounter are SEGY for seismic data and FITS for astronomical data.
SEGY files, used in oil exploration and earthquake studies, store seismic traces, which are recordings of ground motion over time. Each trace comes with its own header containing information like sensor location and recording parameters. FITS, or the Flexible Image Transport System, is the standard for astronomy. It can store multi-dimensional data, like images from different light filters, spectra, or even data cubes that represent a 3D volume of space.
| Feature | SEGY (Seismic) | FITS (Astronomy) |
|---|---|---|
| Primary Data | Time-series waveforms (traces) | Multi-dimensional arrays (images, spectra) |
| Structure | Global headers, trace headers, data traces | Header/Data Units (HDUs) |
| Metadata | Embedded in textual and binary headers | Stored in human-readable ASCII headers |
| Common Use | Oil & Gas exploration, earthquake seismology | Optical & radio astronomy, space telescopes |
Because these aren't standard image formats, you can't just load them with typical image libraries. You'll need specialized Python libraries like segyio for SEGY data and astropy for FITS files. These tools understand the unique structure of each format and let you access both the data and the crucial metadata within.
Normalization and Noise
Geophysical data is often plagued by a low signal-to-noise ratio (SNR). An image from a distant galaxy might be incredibly faint, with the light from the object barely outshining the background noise of the sensor and sky. Similarly, a seismic signal from a small, distant earthquake can be easily lost in the ambient vibrations of the Earth.
Astronomical images also have an enormous dynamic range. A single image might contain both the faint glow of a nebula and the blinding light of a nearby star. If you scale the pixel values linearly from 0 to 1, the faint details will be completely crushed into black. Standard normalization won't work.
To handle this, astronomers often use non-linear scaling, such as a logarithmic or square root stretch. This compresses the range of the bright pixels while expanding the range of the dim ones, making the faint, scientifically interesting features visible without saturating the bright areas.
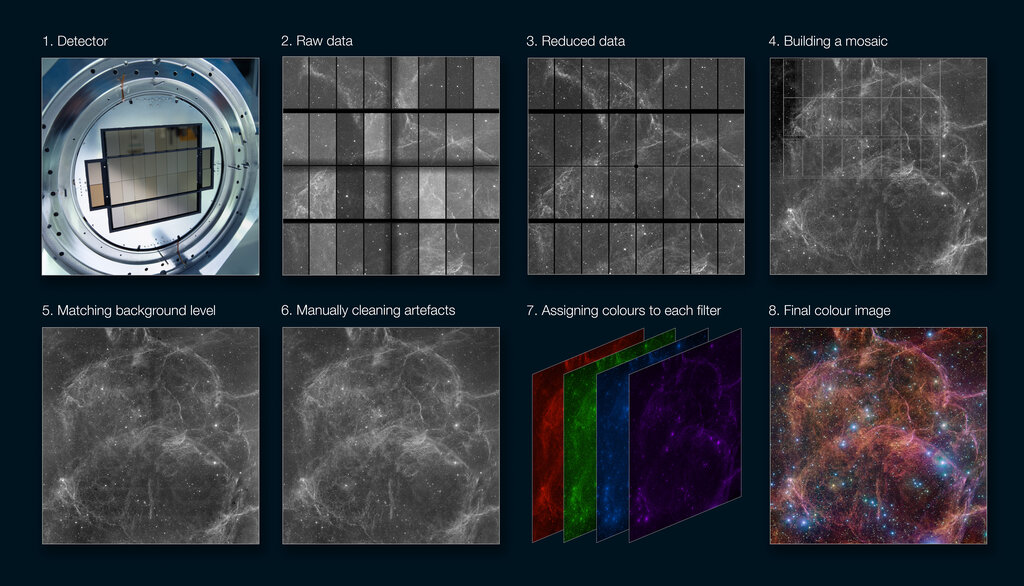
For seismic data, the challenge is different. The absolute amplitude of a seismic waveform is physically meaningful—it relates directly to the magnitude of the ground shaking. Simply scaling all your data to a fixed range, like [-1, 1], could destroy this information. A better approach is often to normalize each trace by its own maximum amplitude or to use a global scaling factor derived from the physics of the problem. This preserves the relative amplitudes between different events, which is critical for many machine learning models.
Changing Your Perspective
Sometimes, the raw data isn't the best representation for a machine learning model. A raw seismic waveform is a series of amplitudes over time. But often, the most important information is in its frequency content. A high-frequency signal might indicate a sharp, nearby event, while a low-frequency rumble could be a distant earthquake.
To capture this, we can transform the data from the time domain to the time-frequency domain using techniques like the Short-Time Fourier Transform (STFT) or wavelet transforms. This creates a spectrogram, which is essentially an image showing how the signal's frequency content changes over time. Many generative models, especially those based on computer vision architectures, perform much better when fed these spectrograms instead of the raw 1D waveforms.
Missing data is another common headache. Satellite images often have gaps or stripes due to sensor errors or bad weather. A seismic network might have dead channels. Simply ignoring this missing data isn't an option. Preprocessing pipelines must include steps for handling it, for instance by using spatial interpolation to fill in missing pixels based on their neighbors or by using more sophisticated inpainting techniques that leverage machine learning to generate realistic data for the gaps.
Throughout all these steps—from reading the file to normalizing and transforming the data—it's vital to preserve the physical units. Your raw data might be in counts from a detector, volts from a seismometer, or uncalibrated digital numbers. The preprocessing pipeline should convert these into meaningful physical units, like watts per square meter, meters per second, or astronomical magnitude. This ensures that the output of your generative model can be interpreted correctly in a scientific context.
What are the two specialized data formats discussed for storing seismic and astronomical data, respectively?
Why is a simple linear normalization often ineffective for astronomical images?