Functional Data Analysis Explained
Introduction to Functional Data Analysis
Data in Motion
In many fields, we think of a data point as a single number. For example, a person's height, the price of a coffee, or the score on a test. We might collect many of these data points and put them in a spreadsheet. Each row is a person or item, and each column is a characteristic we've measured.
But what if a single data point isn't a number, but an entire curve? Think about the temperature in your city over 24 hours. That's not one number; it's a continuous line that rises and falls. Or consider a signature—it's a fluid shape, not a simple value. This is the world of functional data.
functional data
noun
Data where each observation is a function, such as a curve, surface, or anything that varies over a continuum (like time or space).
Functional Data Analysis, or FDA, is the branch of statistics that works with this kind of data. Instead of analyzing a collection of numbers, we analyze a collection of functions. Each function is treated as a single, complete observation.
Beyond Spreadsheets
Traditional data analysis and functional data analysis answer different kinds of questions because they see data differently. A traditional approach might measure the temperature at noon every day. It would tell you the average noon temperature or the hottest noon on record.
FDA, on the other hand, looks at the entire 24-hour temperature curve for each day. It can answer questions about the shape of the data. For instance, on which days did the temperature rise the fastest in the morning? Is the pattern of daily temperature change different in the summer versus the winter? This approach preserves the continuous nature of the information.
| Feature | Traditional Data Analysis | Functional Data Analysis |
|---|---|---|
| Unit of Observation | A single number (scalar) or a set of numbers (vector). | An entire function or curve. |
| Example | Height of a person. | A child's growth chart over 10 years. |
| Focus | Values, averages, variance. | Shape, patterns, rates of change. |
| Tool | Spreadsheet, basic statistics. | Specialized statistical methods (FDA). |
FDA lets us analyze the entire story of the data, not just snapshots.
Applications Across Fields
The ability to analyze functions opens up new possibilities in many areas. It's used wherever data is collected continuously over time or space.
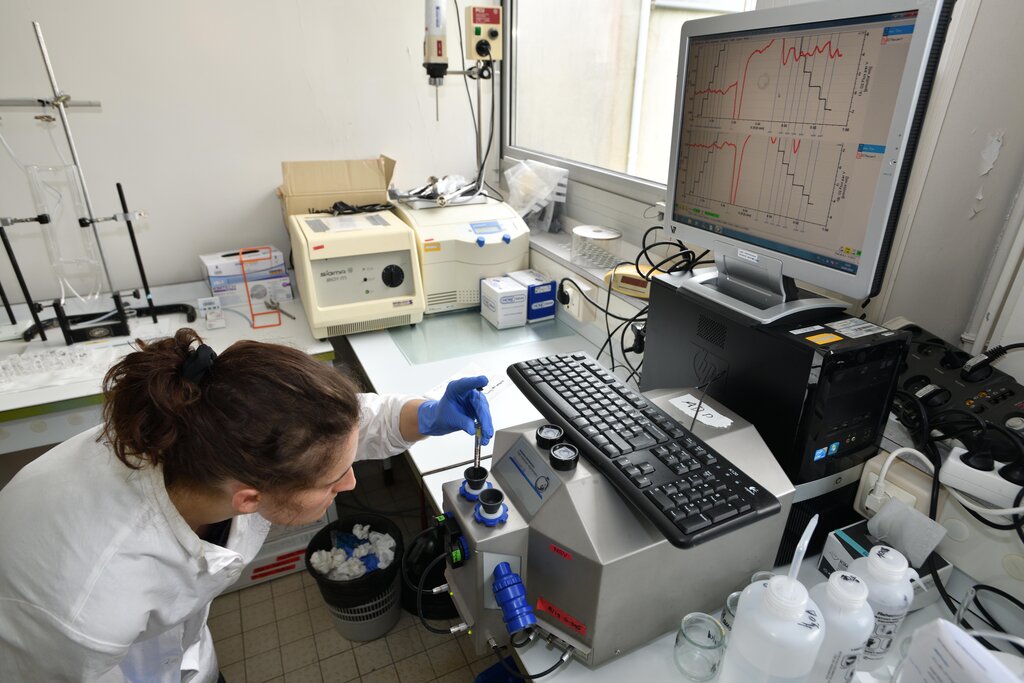
In medicine, doctors can analyze electrocardiogram (EKG) signals from multiple patients to find patterns that predict heart conditions. Each patient's complete EKG waveform is a single data point.
In sports science, the motion of a pitcher's arm or a golfer's swing can be captured as a function. By analyzing these curves, coaches can identify what separates an elite athlete from an amateur.
In finance, the price of a stock throughout a trading day is a function. Analysts can study these intraday patterns across hundreds of stocks to understand market behavior better.
Even in manufacturing, the smoothness of a painted surface along a line can be measured and treated as functional data to ensure quality control.
By shifting our perspective from discrete points to continuous functions, Functional Data Analysis provides a powerful lens for understanding the complex, dynamic processes that shape our world.