From Business Intelligence to AI Architect
Predictive Modeling Workflows
From Reporting to Predicting
In business intelligence, your world revolves around understanding what happened. You use tools like Tableau or Looker to query databases and build dashboards that summarize historical data. You answer questions like, "What were our sales last quarter?" or "Which marketing channel had the highest conversion rate?" This is the realm of descriptive analytics.
Predictive analytics asks a different question: "What will happen next?" Instead of writing SQL queries to aggregate past events, you train a machine learning model to learn patterns from that history. The goal is to create a system that can make educated guesses about the future. This shift requires a new way of thinking about data.
Instead of writing explicit rules, you provide examples and let the model figure out the rules for itself.
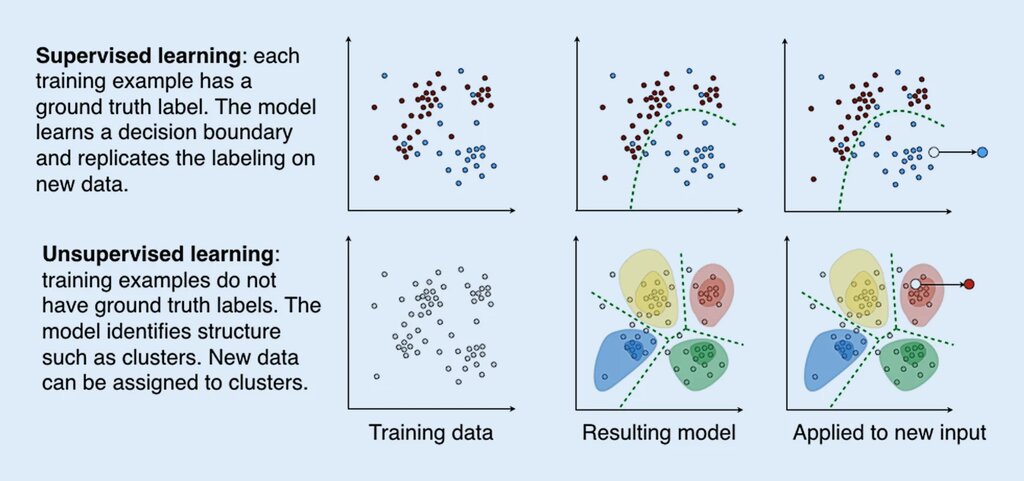
Machine learning is broadly split into two categories. Unsupervised learning is about finding hidden structures without a specific goal. Think of it as automatic customer segmentation, where the algorithm groups similar users together without you telling it what to look for. It's great for exploration.
This article focuses on supervised learning, the workhorse of predictive BI. Here, you have a specific target you want to predict. You provide the model with historical data that includes the "right answers." For example, you might use a dataset of past customers, where each customer is labeled as either "churned" or "active." The model learns the relationship between customer behaviors and the final outcome.
From Aggregates to Features
As a BI professional, you're skilled at using SQL to transform and aggregate data for reports. You might calculate SUM(sales) or AVG(session_duration). The move to predictive modeling involves a similar but distinct process called feature engineering an art and science that's crucial for model performance.
A feature is an individual, measurable property or characteristic of the data. For a model, features are the predictive signals it uses to make a guess.
Instead of just rolling up numbers for a chart, you're creating explanatory variables for a model. Imagine you have a raw SQL table of customer transactions.
- A descriptive query might be:
SELECT customer_id, COUNT(*) FROM transactions GROUP BY 1; - For a predictive model, you'd engineer features like:
time_since_last_purchase,average_purchase_value,total_items_in_cart, or a flag foris_weekend_shopper.
These features give the model context. A model can learn that customers who haven't purchased in 90 days and who typically buy on weekends are more likely to churn. Your domain knowledge becomes your superpower in creating these signals.
Training and Testing Your Model
Once you have your features, you can't just feed all your data to the model and trust its output. Doing so would be like giving a student an exam and the answer key at the same time. They'd get a perfect score, but you wouldn't know if they actually learned anything.
To properly evaluate a model, you must test it on data it has never seen before. This is done by splitting your dataset into at least two pieces:
- Training Set: This is the majority of your data (e.g., 80%) used to teach the model. The model looks at the features and the corresponding outcomes in this set to learn the underlying patterns.
- Test Set: This is a smaller, holdout portion (e.g., 20%) used to evaluate the model's performance. After the model is trained, you ask it to make predictions on the test set and compare its answers to the actual outcomes.
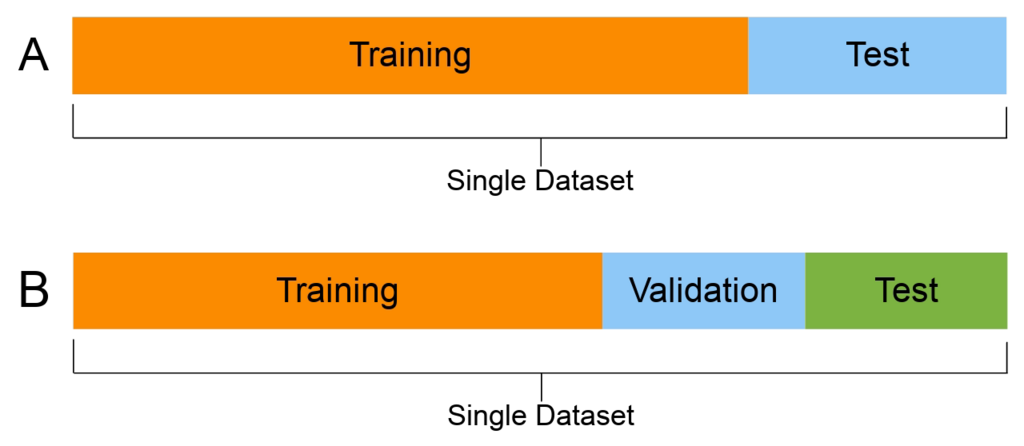
This train-test split guards against overfitting, a common pitfall where a model learns the training data too well, including its noise and quirks, but fails to generalize to new data. A more robust technique is , where the data is split into multiple train-test sets, and the model is trained and evaluated several times. This gives a more reliable estimate of its real-world performance.
Choosing the Right Tool
The type of supervised learning algorithm you choose depends entirely on your business objective. What are you trying to predict?
| Task Type | Business Question | Example | Algorithm Examples |
|---|---|---|---|
| Regression | How much? How many? | Predict next month's sales. | Linear Regression, Decision Tree Regressor |
| Classification | Which one? Will it? | Will this customer churn? | Logistic Regression, Random Forest Classifier |
A regression model predicts a continuous numerical value. If your goal is to forecast a number, like revenue or customer lifetime value, you need a regression algorithm. A classification model predicts a discrete category. If your goal is to assign a label, like fraud or not fraud, or churn or no churn, you need a classification algorithm.
In the Python ecosystem, the scikit-learn library provides a consistent and powerful framework for building these models. It lets you create a pipeline, which is a sequence of data processing and modeling steps chained together. You might have a step for handling missing values, another for scaling features, and a final step for the model itself.
# A simple scikit-learn pipeline
from sklearn.pipeline import Pipeline
from sklearn.impute import SimpleImputer
from sklearn.preprocessing import StandardScaler
from sklearn.linear_model import LogisticRegression

# Define the steps
pipe = Pipeline([
    ('imputer', SimpleImputer(strategy='mean')),
    ('scaler', StandardScaler()),
    ('classifier', LogisticRegression())
])

# Train the entire pipeline on training data
pipe.fit(X_train, y_train)

# Make predictions on test data
predictions = pipe.predict(X_test)
This architecture is powerful because it ensures the same transformations are applied consistently to your training and test data, preventing data leakage. It treats your entire workflow as a single object that can be trained, evaluated, and deployed. This is a fundamental shift from running isolated SQL scripts to building a reproducible, end-to-end predictive system.
What is the primary difference between descriptive analytics and predictive analytics?
A data analyst is creating variables for a model to predict which customers are likely to stop using a service. Which of the following is the best example of feature engineering for this model?
Moving from descriptive to predictive analytics is a shift in mindset and tooling. It's about going beyond summarizing the past to building models that can generalize patterns and help you anticipate the future.