FP&A Manager Excellence and Advancement
Advanced Financial Modeling
Beyond Static Forecasts
Your standard financial model produces a single forecast. It's a useful, but rigid, view of the future. To provide real strategic value, your models need to become dynamic tools that explore possibilities and pinpoint risks. This means moving beyond a single set of assumptions to build models that answer the critical "what if?" questions that leadership will inevitably ask.
We'll focus on two powerful techniques for this: scenario analysis, which models entire alternative futures, and sensitivity analysis, which isolates the impact of individual variables. Mastering these will transform your financial models from simple calculators into indispensable strategic guides.
Modeling Different Futures
Scenario analysis involves creating a few distinct, plausible versions of the future. You're not just tweaking one number; you're changing a whole set of related assumptions to tell a coherent story. The most common approach is to build three scenarios: a base case, an upside case, and a downside case.
Think of it like planning a road trip. The base case is your planned route. The upside case is finding a shortcut with no traffic. The downside case is hitting a major storm that forces a long detour. Each scenario requires a different set of plans and resources.
Let's say your company is launching a new product. Your assumptions for each scenario might look something like this:
| Driver | Downside Case | Base Case (Expected) | Upside Case |
|---|---|---|---|
| Market Share Attained | 1.5% | 2.5% | 4.0% |
| Average Selling Price | $90 | $100 | $105 |
| Variable Cost Per Unit | $55 | $50 | $48 |
| Marketing Spend | $1.2M | $1.0M | $1.0M |
Notice how the drivers are linked. In the downside case, you capture less market share and have to lower prices to compete, while your costs are higher than expected. In the upside case, strong demand allows for a slightly higher price and better economies of scale reduce your costs. Each column tells a story.
The goal isn't just to see the different profit outcomes. It's to understand the conditions that lead to them. This helps the business prepare. If the downside scenario is catastrophic, what contingency plans can be put in place now to mitigate those risks?
Pinpointing Key Drivers
While scenario analysis looks at wholesale changes, sensitivity analysis is more surgical. It answers the question: "If I change just one input variable by 10%, how much does my output change?" It's a method for identifying the variables that have the biggest impact on your results. These are the assumptions you need to get right.
There are several ways to conduct sensitivity analysis in a model. One of the most effective tools for this in Excel is a Data Table. Let's imagine you want to see how Net Present Value (NPV) changes based on two key variables: the discount rate and the long-term revenue growth rate.
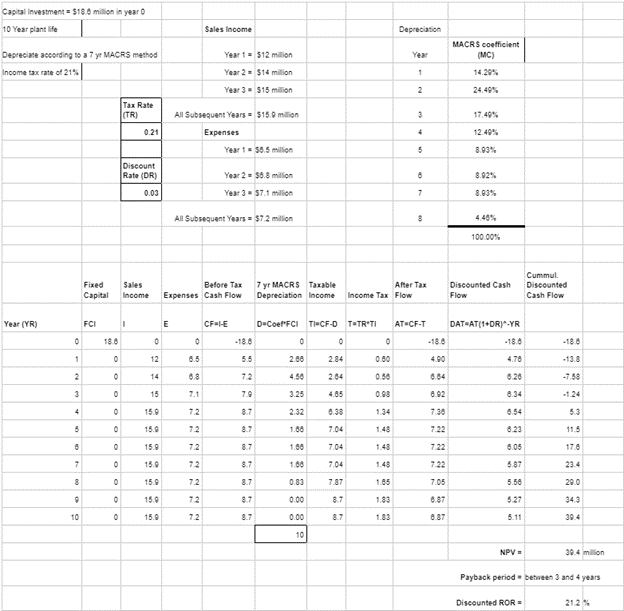
You can set up a two-variable data table to see the combined effect. You would list potential discount rates down the first column and potential growth rates across the top row. In the corner cell, you link to your NPV calculation. Excel then populates the table, showing you the NPV for every combination of the two variables.
This quickly reveals where the biggest risks and opportunities lie. If a small change in your discount rate causes a massive swing in NPV, you know that's a critical assumption to validate and monitor.
Building Dynamic Models
To perform these analyses efficiently, your model needs to be dynamic. This means it should be built around a dedicated assumptions section. All key drivers—growth rates, margins, inflation, etc.—should be listed in one place. Every formula in your model should then reference these assumption cells, not hardcoded numbers.
This structure allows you to change a single assumption, like the customer churn rate, and watch the entire model update instantly. It's the foundation for all advanced analysis. Another key is integrating data from various sources without manual copy-pasting, which is prone to errors.
Excel's Power Query is an essential tool for this. It can connect to databases, spreadsheets, and web pages. It lets you create repeatable steps to clean, transform, and merge data before it even enters your model. You can combine sales data from your CRM with expense data from your accounting system, ensuring your model is always fed with the latest, most accurate information. Set up the query once, and you can refresh the data with a single click.
Ninja-level Excel skills: These skills empower strategic finance professionals to transform any data set or data problem into a clear analysis with actionable insights.
Some advanced functions are also crucial for building flexible models. Instead of nested IF statements, which can become messy and hard to audit, use functions like IFS, SWITCH, or CHOOSE. For more complex lookups, INDEX and MATCH are more powerful and flexible than VLOOKUP. And for handling calculations that depend on dynamic date ranges, SUMIFS combined with EOMONTH can be incredibly powerful.
For example, to sum revenue for a specific month based on a date in cell A1, you don't need a complex formula. You can use:
=SUMIFS(RevenueColumn, DateColumn, ">=" & A1, DateColumn, "<=" & EOMONTH(A1, 0))
This formula dynamically sums all revenue between the first and last day of the month specified in cell A1. It's clean, efficient, and adapts automatically if you change the date.
What is the primary difference between scenario analysis and sensitivity analysis in financial modeling?
When building a dynamic financial model, why is it crucial to have a dedicated 'Assumptions' section?
Ultimately, an advanced financial model is a communication tool. Its purpose is to take complex data and turn it into clear, actionable insights that guide strategy. By mastering these techniques, you move from simply reporting the numbers to shaping the decisions that drive them.