Foundations of Statistical Understanding
Introduction to Statistics
What is Statistics?
Statistics is the science of collecting, analyzing, and interpreting data. It's a way to make sense of the world using numbers.
You encounter statistics every day, even if you don't realize it. Weather forecasts use statistical models to predict rain. Your favorite sports team uses stats to evaluate players. Doctors rely on statistical studies to know if a new medicine works.
It’s a powerful tool for turning raw information into meaningful insights, helping us spot trends, make predictions, and make better decisions.

Two Branches of Statistics
Statistics can be split into two main areas: descriptive and inferential.
Descriptive statistics is all about summarizing the data you have. Think of it like writing a one-paragraph summary of a book. You’re not reading every word, but you’re getting the main points. It organizes data into manageable chunks, often using graphs and charts.
Descriptive statistics describe and summarize what the data shows.
Inferential statistics, on the other hand, is about making educated guesses. You use data from a small group to draw conclusions about a much larger one. It’s like tasting one grape to decide if the whole bunch is sweet.
This branch uses probability to determine how confident we can be in our conclusions. It’s the part of statistics that allows pollsters to predict election outcomes by surveying just a few thousand people.
Inferential statistics use a sample to make generalizations about a larger population.
| Feature | Descriptive Statistics | Inferential Statistics |
|---|---|---|
| Goal | Summarize and describe data | Make predictions or inferences |
| Scope | Uses the collected data | Goes beyond the data you have |
| Form | Charts, graphs, averages | Probability, hypothesis tests |
| Example | The average height of students in a class | The predicted average height of all students in the school |
Populations and Samples
To understand inferential statistics, you need to know the difference between a population and a sample.
Population
noun
The entire group of individuals or objects that you want to study.
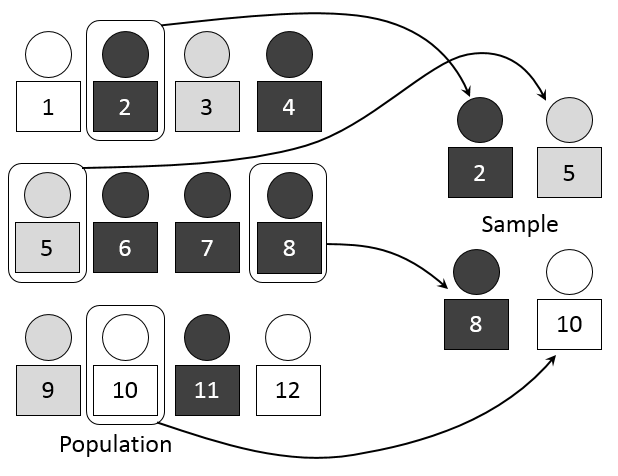
Studying an entire population is often impractical or impossible. It could be too expensive, time-consuming, or just too large. Imagine trying to survey every coffee drinker in the world. That's where samples come in.
Sample
noun
A smaller, manageable subset of the population that is selected for study.
The key is to select a sample that is representative of the whole population. If your sample accurately reflects the larger group, you can use it to make reliable inferences.
Understanding Your Data
In any statistical study, we collect information about specific characteristics. These characteristics are called variables.
Variable
noun
Any characteristic, number, or quantity that can be measured or counted.
Variables can be broken down into two main types: qualitative and quantitative.
Qualitative (or Categorical) variables describe a quality or characteristic. They place individuals into categories or groups. Examples include eye color (blue, green, brown), type of car (sedan, SUV, truck), or yes/no answers.
Quantitative variables are measured or counted and are expressed as numbers. They can be further divided into discrete (countable items, like the number of pets in a household) and continuous (measurable values, like height or weight).
Knowing the type of variable you're working with is crucial because it determines the types of statistical analyses you can perform.
To get even more specific, we can classify data into four levels of measurement: nominal, ordinal, interval, and ratio.
| Level | Description | Example |
|---|---|---|
| Nominal | Categories with no natural order or ranking. | Eye color, nationality, gender |
| Ordinal | Categories with a meaningful order, but the differences between ranks are not equal or measurable. | Education level (High School, Bachelor's, Master's), customer satisfaction (Unhappy, Neutral, Happy) |
| Interval | Ordered data where the difference between two values is meaningful, but there is no true zero point. | Temperature in Celsius or Fahrenheit, years on a calendar |
| Ratio | Ordered data with equal intervals and a true zero, meaning zero represents a complete absence of the variable. | Height, weight, age, income |
Each level of measurement builds on the one before it, offering more precision and allowing for more complex statistical analysis.
A political pollster surveys 1,200 likely voters to predict the outcome of a national election involving millions of voters. What type of statistics is primarily being used to make this prediction?
A study calculates the average height of all players currently in the NBA. This single number (the average height) is an example of...