Foundations of Statistical Understanding
Introduction to Data
What Is Data?
Data is simply information. It can be a collection of facts, numbers, observations, or descriptions. When you look at the price of a coffee, the color of a car, or the rating you give a movie, you're interacting with data. In statistics, we use this raw information to find patterns and make sense of the world.
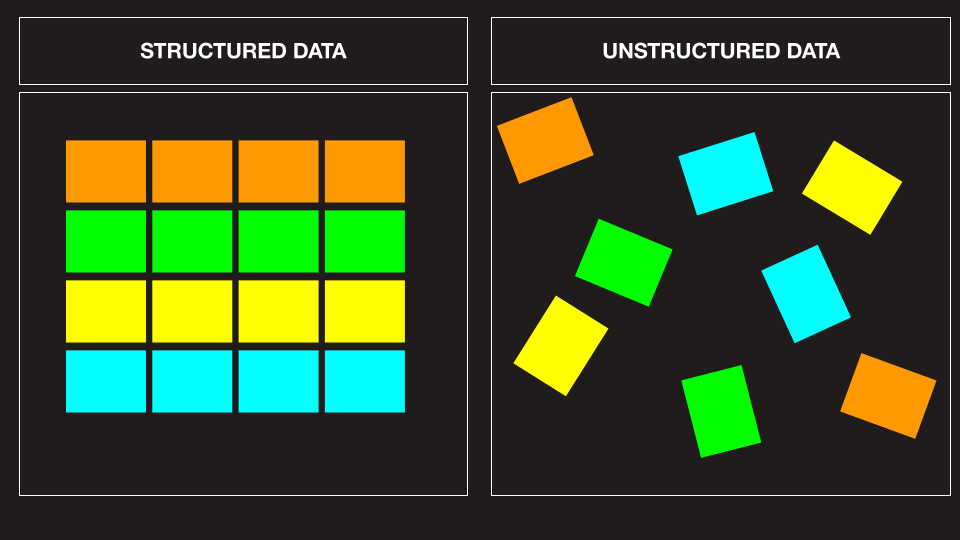
Before we can analyze anything, we need to understand what kind of data we're working with. The most fundamental way to classify data is to split it into two main categories: qualitative and quantitative. Getting this distinction right is the first step in any sound analysis.
Two Flavors of Data
Think of qualitative data as descriptive information. It deals with characteristics and qualities that can't be measured with numbers. This type of data, also known as categorical data, sorts things into groups. If you're describing someone's eye color (blue, brown, green) or their favorite type of music (rock, pop, jazz), you're using qualitative data.
Qualitative data answers questions like "what kind?" or "which category?" It's about the quality, not the quantity.
On the other hand, quantitative data is all about numbers. It's information that can be measured or counted. This data tells you "how much," "how many," or "how often." Your height in centimeters, the temperature outside in degrees, or the number of students in a class are all examples of quantitative data.
| Feature | Qualitative Data | Quantitative Data |
|---|---|---|
| Type | Categorical | Numerical |
| Measurement | Describes qualities | Measured or counted |
| Examples | Hair color, city of birth | Height, weight, age |
| Key Question | "What kind?" | "How many?" |
Levels of Measurement
To get even more specific, we can classify data into four levels of measurement. These levels—nominal, ordinal, interval, and ratio—tell us how precisely our data is measured. Each level builds on the one before it, adding more structure and allowing for more complex analysis.
Let's break down each level.
Nominal
adjective
Data at the nominal level are used for labeling variables without any quantitative value. The categories have no order or ranking.
Think of nominal data as names or labels. Examples include gender, country of origin, or the color of M&Ms. You can count how many fall into each category, but you can't logically order them from best to worst or highest to lowest.
Ordinal
adjective
Ordinal data represents categories that have a meaningful order or rank, but the intervals between the ranks are not necessarily equal.
With ordinal data, order matters. For example, the rankings in a race (1st, 2nd, 3rd) are ordinal. You know that 1st place is better than 2nd, but you don't know if the winner finished seconds or minutes ahead. The gap between the values isn't defined.
Interval
noun
Interval data has a meaningful order and equal intervals between values, but it lacks a true zero point.
At the interval level, the difference between two points is consistent and meaningful. For example, the difference between the years 2000 and 2010 is the same as the difference between 1980 and 1990: ten years. However, the year 0 doesn't mean the absence of time. Because there's no true zero, you can't say that the year 2000 is twice as long as the year 1000.
Ratio
noun
The highest level of measurement, ratio data has all the properties of interval data but with a true, meaningful zero point.
Ratio data is the most informative. It includes things like height, weight, age, and money. Because there's a true zero, you can make ratio comparisons. For example, a 200-pound person is twice as heavy as a 100-pound person, and $10 is half of $20. All sorts of mathematical operations are possible with ratio data.
Why It All Matters
Classifying data isn't just an academic exercise. The type of data you have determines the type of statistical analysis you can perform. You can't calculate the average hair color, just as you wouldn't just count the number of different temperatures recorded.
Knowing your data's level of measurement is like having a map. It guides you toward the right analytical tools and away from misleading conclusions.
For example, you can calculate the mean (average) of interval and ratio data, but it's meaningless for nominal or ordinal data. Understanding these distinctions ensures your analysis is valid and your insights are accurate. It's the foundation for everything else you'll do with statistics.
Which of the following is the best example of qualitative data?
A survey asks participants to rate their satisfaction on a scale from 'Very Unsatisfied' to 'Very Satisfied'. What level of measurement is this data?
With these foundational concepts in place, you're ready to start exploring data more deeply.