Foundations of Data Analysis
Data and Variables
Data Is Just Information
At its heart, data is simply a collection of facts. Think about your grocery list. It has items (milk, bread, eggs), quantities (1 gallon, 1 loaf, 1 dozen), and maybe even prices. That list is a form of data. It's information organized in a useful way.
Data Analysis
noun
The process of inspecting, cleaning, transforming, and modeling data with the goal of discovering useful information, informing conclusions, and supporting decision-making.
When we organize data, we often put it into a table, like a spreadsheet. This organized collection is called a datasets. Imagine a digital filing cabinet where each folder contains information about a specific topic. A dataset about your friends might include their names, birthdays, and favorite foods.
The Building Blocks
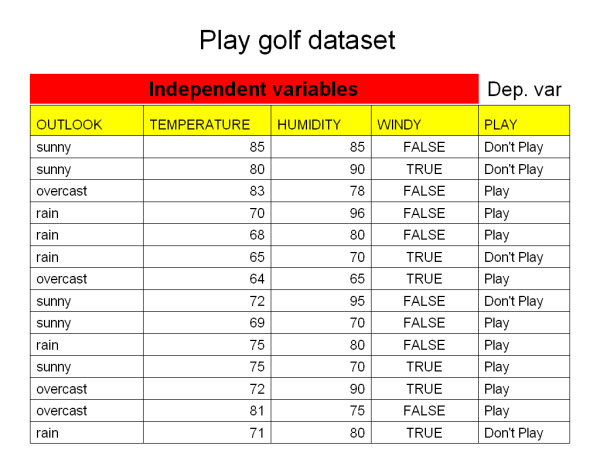
Every dataset is built from two key components: observations and variables. Let's break that down using the golf example above.
Each row in that table is an observation. It's a single, complete record. For instance, one row records a specific day that was sunny, hot, and humid, and on that day, golf was not played. Think of it as one complete entry in a logbook.
Each column is a variable. A is a characteristic that can change or vary from one observation to another. In the golf dataset, the variables are OUTLOOK, TEMPERATURE, HUMIDITY, WINDY, and PLAY. The value of the OUTLOOK variable can be 'Sunny', 'Overcast', or 'Rainy' depending on the day (the observation).
Two Flavors of Data
Variables can be sorted into two main types: qualitative and quantitative. This is just a fancy way of saying data can be either descriptive words or meaningful numbers.
data describes qualities or characteristics. It's often text-based. Words like 'Sunny', 'Overcast', and 'Rainy' from our golf example are qualitative. Other examples include colors ('blue', 'green'), textures ('smooth', 'rough'), or categories ('cat', 'dog', 'fish'). You can't really do math with this kind of data.
data deals with quantities or numbers. It's information that can be measured. A person's height, the temperature outside, or the price of a coffee are all quantitative. This is the data you can perform calculations on, like finding an average or a total.
Qualitative data is descriptive (e.g., car color). Quantitative data is numerical (e.g., car price).
So, to recap, data is just structured information. We organize it into datasets, which are made of observations (rows) and variables (columns). And those variables can hold descriptive (qualitative) or numerical (quantitative) information. Understanding these basic ideas is the first step into the world of data analysis.
Ready to check your understanding? Let's see what you've learned.
An organized collection of data, often structured in a table with rows and columns, is called a ______.
A car dealership tracks the color of each car sold. What type of data is the car's color?
Great job. Now you have a solid foundation for what data is and how it's structured.