Forex Swing Trading Mastery
Multi-Day Market Structure
Reading the Market's Story
Beyond individual candlesticks, the market tells a story through its structure. Price doesn't move in a straight line; it breathes, creating a series of peaks and valleys. These are the fundamental building blocks of a trend, known as swing highs and swing lows.
A swing high is a peak reached before the price pulls back. A swing low is a valley formed before the price rallies.
An uptrend is simply a series of higher highs (HH) and higher lows (HL). A downtrend is a series of lower highs (LH) and lower lows (LL). When price stops making this clear sequence and starts moving sideways, the market is in a range, or consolidation. This structure is the most reliable indicator of the market's current intention.
The Three Market Phases
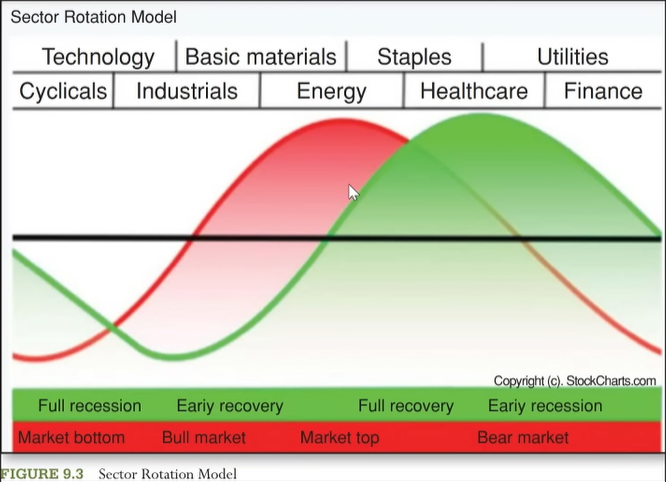
Markets typically move through three distinct phases. Think of it like a coiled spring. First is Accumulation, where price moves sideways in a range. Big players are quietly building positions, and the spring is being compressed. There's no clear trend.
Next comes the Trending phase (also called markup for an uptrend or markdown for a downtrend). The spring is released. Price breaks out of the range and moves decisively in one direction, forming clear swing highs and lows. This is where swing traders find their best opportunities.
Finally, there is Distribution. This phase looks a lot like accumulation, another sideways range. But here, the big players are taking profits and closing out their positions. The trend's energy is fading, often setting up a reversal.
Combining Timeframes
To truly understand market structure, you need to zoom out. A strong move on a 4-hour (H4) chart might just be a minor pullback on a Daily (D1) chart. This is why multi-timeframe analysis is non-negotiable for swing traders. The D1 chart tells you the overall story—the dominant, multi-day trend. The H4 chart shows you the current chapter, giving you clearer opportunities to enter in alignment with that larger trend.
Think of the daily chart as the forest and the 4-hour chart as the trees. You need to know the direction of the forest before you start navigating among the individual trees. If the D1 chart is in a clear uptrend (making higher highs and lows), you should primarily look for buying opportunities on the H4 chart during pullbacks.
Use daily charts for broader institutional zones, 4-hour charts for swing trades, and 1-hour charts for more precise intraday setups [3].
Real Breaks vs. Fakeouts
A key challenge is telling the difference between a real change in market structure and a false break, often called a fakeout or liquidity grab. A occurs when price closes decisively beyond a previous swing high (in an uptrend) or low (in a downtrend), signaling the trend is likely to continue. It's a confirmation that momentum is still strong.
A false break, on the other hand, happens when price briefly pokes through a key level only to quickly reverse. This is often designed to trigger the stop losses of retail traders. A common rule of thumb is to wait for a candle to close beyond the structure point, not just wick past it. Seeing follow-through price action on the next candle adds even more confirmation.
Now that you can identify market structure and trend, let's test your understanding.
What sequence of price action defines a clear uptrend in market structure?
After a prolonged uptrend, the market begins to move sideways in a tight range. What phase is the market most likely entering?
By correctly identifying the market's phase and the direction of its primary trend, you put the odds in your favor. This structural analysis forms the foundation upon which all successful swing trading strategies are built.