Financial Data Storytelling with Power BI
Introduction to Power BI
What Is Power BI?
Microsoft Power BI is a tool that helps people make sense of data. Think of it as a powerful detective that can look at mountains of information—from simple spreadsheets to complex databases—and find the important stories hidden inside. Instead of just showing rows and columns of numbers, Power BI turns that data into charts, graphs, and maps that are easy to understand at a glance.
Power BI is a data visualization and business intelligence tool that allows users to connect to various data sources, clean and transform data, and build visual dashboards that tell compelling data stories.
Its main job is to connect to your data, clean it up so it's usable, and then help you build reports and dashboards. These visual reports make it much easier to spot trends, track goals, and make informed decisions. Whether you're tracking sales figures, website traffic, or inventory levels, Power BI can help you see what's happening in your business.
Getting Around the Interface
When you first open Power BI and load some data, you'll often start in the Power Query Editor. This is where you prepare your data for analysis. It might look complex at first, but it's organized into a few key areas.
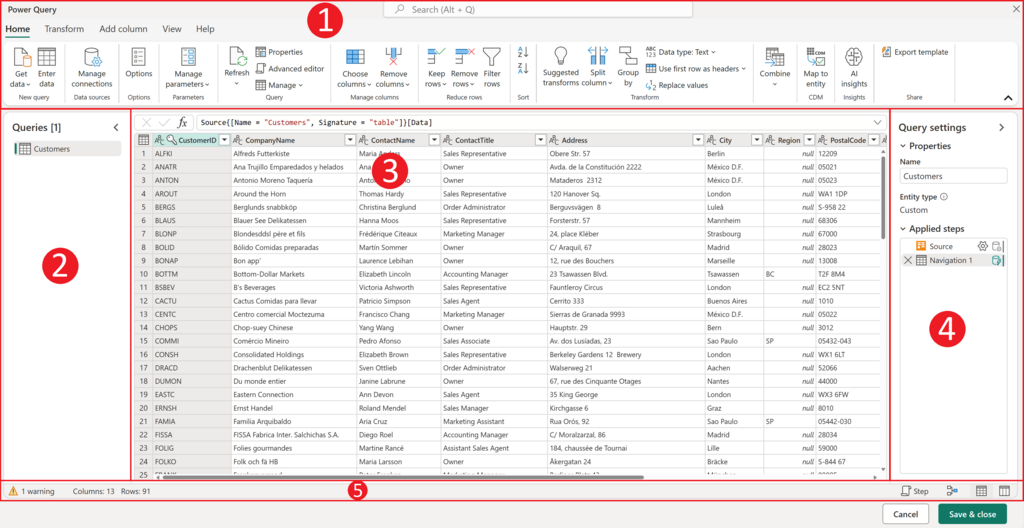
Let's break down the main parts you'll see in the editor, as highlighted in the image above:
- Ribbon: Just like in other Microsoft products, the ribbon at the top contains all the tools and options you can use. You'll find buttons for transforming data, adding columns, and managing settings.
- Queries Pane: On the left, this pane lists all the data tables (or queries) you've connected to. You can select different queries here to work on them one by one.
- Data View: This is the large, central area that shows a preview of your selected table's data. You can see the columns and rows, and get a feel for the information you're working with.
- Query Settings: On the right, this pane is where the magic happens. It shows the properties of your query and, most importantly, a list of all the transformation steps you've applied. Every time you clean or change the data—like removing a column or filtering rows—a new step appears here. You can edit or delete these steps at any time.
Connecting to Data
A business intelligence tool is only useful if it can access your data. Power BI excels at this, offering connections to a massive library of sources. You can pull in data from simple files on your computer or from powerful cloud-based systems.
Power BI integrates seamlessly with a wide range of data sources such as Excel, SQL Server, Azure, and more.
To get started, you'll use the "Get Data" button. This opens a window where you can choose your data source. Let's walk through connecting to one of the most common sources: an Excel workbook.
- Select "Get Data": On the Home tab of the ribbon, click the "Get Data" button. A dropdown menu will appear with common data sources.
- Choose Your Source: Select "Excel workbook" from the list.
- Locate the File: A file browser window will open. Navigate to the location of your Excel file, select it, and click "Open".
- Select Your Data: A "Navigator" window will appear, showing you all the tables and sheets within your workbook. Check the box next to the data you want to import. You'll see a preview on the right.
- Load or Transform: You now have two choices. Clicking "Load" will bring the data into Power BI as-is. Clicking "Transform Data" will open the Power Query Editor, where you can clean and prepare the data before loading it. It's almost always a good idea to select "Transform Data" first.
This basic process is similar for other data sources, whether you're connecting to a CSV file, a webpage, or a database.
What is the primary function of Microsoft Power BI?
In the Power Query Editor, which pane records every cleaning and transformation step you apply to your data?
That's a quick tour of what Power BI is and how to get started. You've learned about its core purpose, how to navigate its interface, and the first steps to connecting and importing your own data.