Excel Tables Explained
Introduction to Excel Tables
Beyond Simple Spreadsheets
Most people use Excel as a simple grid of cells. You type in some data, maybe make a few headers bold, and that's it. This is called a data range. It's just a collection of information sitting in rows and columns.
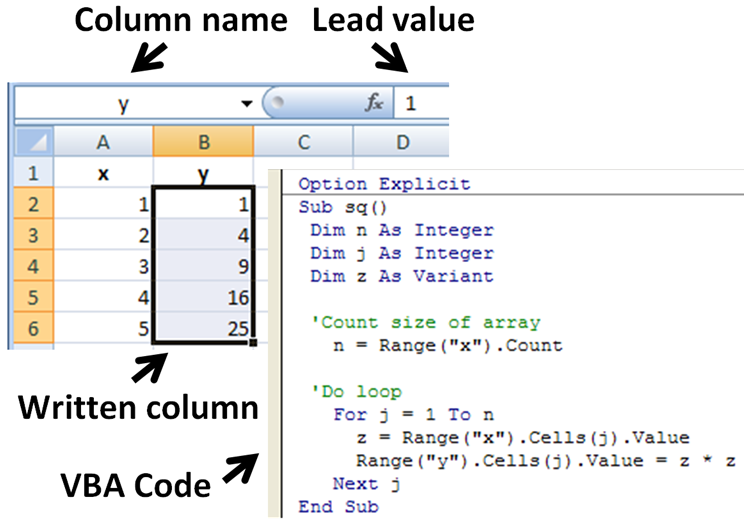
A data range works fine for small, simple lists. But as your data grows, you'll start to notice problems. If you add a new row of data at the bottom, your formulas might not include it. Sorting one column can accidentally scramble the others if you aren't careful. Formatting is a manual chore you have to repeat for every new entry.
An Excel Table is different. It's a special object that tells Excel, "Hey, all these cells belong together. They're part of one cohesive dataset." By converting a simple range into a formal Table, you unlock a set of powerful features that make managing your data much easier.
Converting your data ranges into official Excel Tables (select your data and press Ctrl + T) provides several huge advantages:
The Advantages of Tables
Using a Table isn't just about looks; it’s about making your spreadsheet smarter and more efficient. The biggest benefit is that Tables are dynamic. When you add a new row or column of data next to your table, Excel automatically expands the table to include it. This means any charts or formulas referencing the table update automatically, saving you from constant manual adjustments.
Tables also come with built-in tools for organization. As soon as you create a Table, filter buttons appear in the header row. This allows you to sort your data with a single click, or filter it to show only the entries that meet certain criteria. Formatting is also a breeze. You can apply professional-looking styles with one click, and the formatting, like alternating row colors, automatically extends to new data you add.
In short, Tables turn a static grid of data into a dynamic, manageable database right inside your worksheet.
Anatomy of a Table
Every Excel Table is made up of a few key components. Understanding them is the first step to using tables effectively.
The main parts are:
- Header Row: This is the top row of the table. It contains the names of your columns, like "Product Name," "Price," or "Quantity." The headers are crucial because they describe the data in each column and are used for sorting and filtering.
- Rows: Each row in the table represents a single, complete record. If your table lists products, each row would be one product with all its associated details (name, price, etc.).
- Columns: Each column contains one type of information for every record in the table. For instance, you'd have one column for all the product names and a separate column for all the prices.
By understanding these basic components and the benefits they bring, you're ready to start transforming your simple data ranges into powerful, organized Excel Tables.