Excel Reporting Mastery
Data Organization
Set Your Data Up for Success
Before you can analyze or visualize anything, your data needs to be organized. Think of it like building a house. You need a solid, well-organized foundation before you can put up walls or a roof. In Excel, this foundation is a clean, structured table of data.
The goal is to create a simple, flat table. This means your data is in a grid where each row is a unique record (like a specific sale or a single employee) and each column is a specific attribute of that record (like the sale date or the employee's name). There should be no empty rows or columns breaking up your dataset.
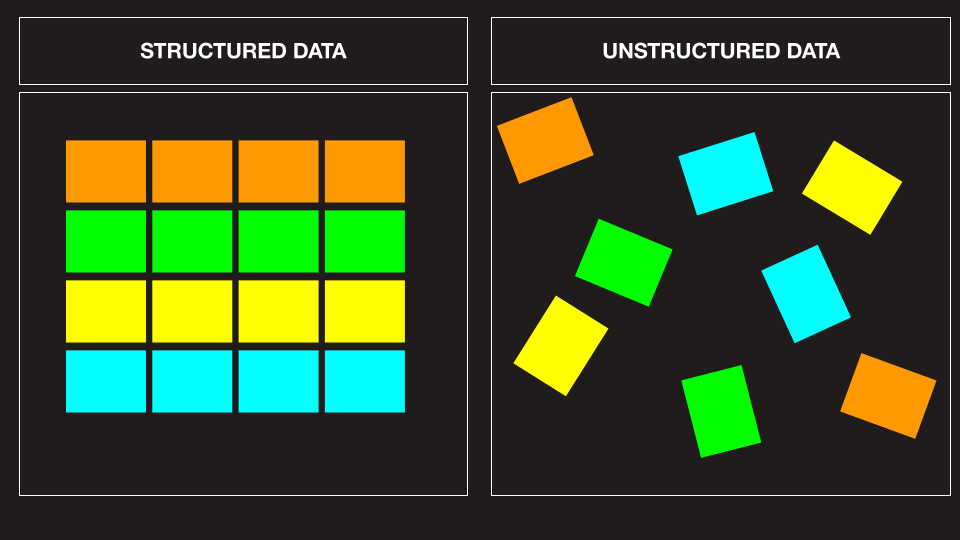
This structure makes it easy for Excel's tools, like sorting and filtering, to understand and work with your information. Let's look at a few core principles for building this foundation.
Clear Column Headers are Key
Every column in your dataset must have a header. This is the non-negotiable first rule of data organization. A good header acts like a signpost, telling you (and Excel) exactly what kind of information is in that column.
Good headers are:
- Unique: No two columns should have the exact same header.
- Descriptive but concise: Someone should be able to understand the column's content just by reading the header. "Sale Date" is better than "Date" or "When the item was sold."
- On one row: Headers should only occupy the very first row of your data table.
The best practices for organizing and structuring data in Excel involve using clear, descriptive headers for columns and rows, avoiding merged cells, maintaining consistency in formatting, and using separate sheets or tabs for different datasets or analyses.
Here's what this looks like in practice. Notice how the 'Good' examples are clear and simple, which makes them perfect for filtering and formulas.
| Bad Headers | Good Headers |
|---|---|
| Name (First/Last) | First Name, Last Name (in two columns) |
| Amount ($) | Sale Amount |
| Q1 Sales | Q1_Sales |
| Date | Order Date |
The Trouble with Merged Cells
Merging cells can make a spreadsheet look clean to the human eye, but it's a disaster for data analysis. Merging combines two or more cells into one larger cell. While it might seem useful for creating titles that span multiple columns, it breaks the fundamental grid structure that Excel relies on.
When you merge cells, you create problems for sorting, filtering, and writing formulas. For example, if you try to sort a column that has merged cells, Excel might not be able to do it, or it will produce unexpected results. The data is no longer in a simple column that can be easily rearranged.
If you want to center a title across several columns, use the "Center Across Selection" formatting option instead of merging cells. It gives you the same visual effect without breaking your data structure.
Look at this table. The goal is to sort the data by region to see all the East region sales together. With the merged cell, Excel can't perform the sort properly because the cell 'East' technically only exists in the first row of that group, leaving the others blank.
| Before Sorting (with Merged Cells) | After Failed Sort |
|---|---|
| Region | Sales |
| East | $100 |
| $150 | |
| West | $200 |
The sort operation fails or behaves unpredictably because of the merged cell.
By filling in the data for every single row, the sort works perfectly.
| Correct Structure (No Merged Cells) | After Successful Sort |
|---|---|
| Region | Sales |
| East | $100 |
| East | $150 |
| West | $200 |
Keeping Your Data Consistent
Data integrity means your data is accurate, consistent, and reliable. Inconsistent data can ruin your analysis. If you have "CA," "Calif.," and "California" in a state column, Excel sees them as three different places. This will lead to inaccurate counts and summaries.
Here are a few rules to ensure data integrity:
- One piece of data per cell. Don't put a full address in a single cell. Split it into "Street," "City," "State," and "Zip Code" columns.
- Be consistent with formatting. Dates should all be in the same format (e.g., MM/DD/YYYY). Text should have consistent capitalization (e.g., always use "East" not "east" or "EAST").
- No blank rows or columns. An empty row or column can signal the end of a dataset to Excel, causing tools to ignore any data that comes after it.
Following these simple organization rules is the most critical step in using Excel effectively. It saves you from headaches later and makes any reporting or analysis work much smoother.
What is the most fundamental principle for organizing data in Excel for effective analysis?
Which of the following describes a key problem caused by merging cells within a data table?