Excel Pivot Tables Made Easy
Introduction to Pivot Tables
What Are Pivot Tables?
Imagine you have a spreadsheet with thousands of rows of sales data. It tracks every single transaction: the product sold, the region, the date, the sales rep, and the amount. Trying to answer a simple question like, "What were our total sales for each product in the North region last quarter?" could take hours of sorting, filtering, and manual calculations.
A Pivot Table is Excel's solution to this problem. It's a tool that lets you summarize large amounts of data quickly and dynamically. Think of it like a set of building blocks. Your raw data is a big pile of unsorted blocks. A Pivot Table lets you rearrange those blocks to build different structures, showing you the exact view you need without changing the original pile.
Essentially, a Pivot Table takes flat, intimidating data and transforms it into an interactive summary report.
The Building Blocks
When you create a Pivot Table, you'll work with a control panel that has four main areas. You simply drag and drop your data fields (like "Region" or "Sales Amount") into these areas to build your report.
1. Rows: These are the labels that appear down the left side of your table. If you want to see sales by product, you would drag the "Product" field here. Each unique item in that field becomes a row header.
2. Columns: These create the labels across the top of your table. To compare sales across different quarters, you could drag a "Quarter" field here.
3. Values: This is where the numbers go. It's the data you want to summarize, like summing up sales totals or counting the number of transactions. You'd drag a field like "Sales Amount" here. Excel will automatically calculate the result (e.g., Sum of Sales, Average of Sales).
4. Filters: This area lets you focus on a specific slice of your data. For example, if you only want to see data for the "North" region, you could drag the "Region" field into the Filters area and select "North".
Why It Matters
The power of Pivot Tables comes from their interactivity. You can rearrange your report in seconds by moving fields between the four areas. Want to see regions as columns instead of rows? Just drag the field. Want to see an average instead of a sum? A couple of clicks will change the calculation.
This flexibility makes them an essential tool for data analysis for several key reasons:
Speed: Summarize millions of rows of data almost instantly. Flexibility: Easily pivot your data to see it from different perspectives. Accuracy: Automatic calculations eliminate the risk of manual errors. Clarity: Uncover trends, comparisons, and patterns that are impossible to see in raw data.
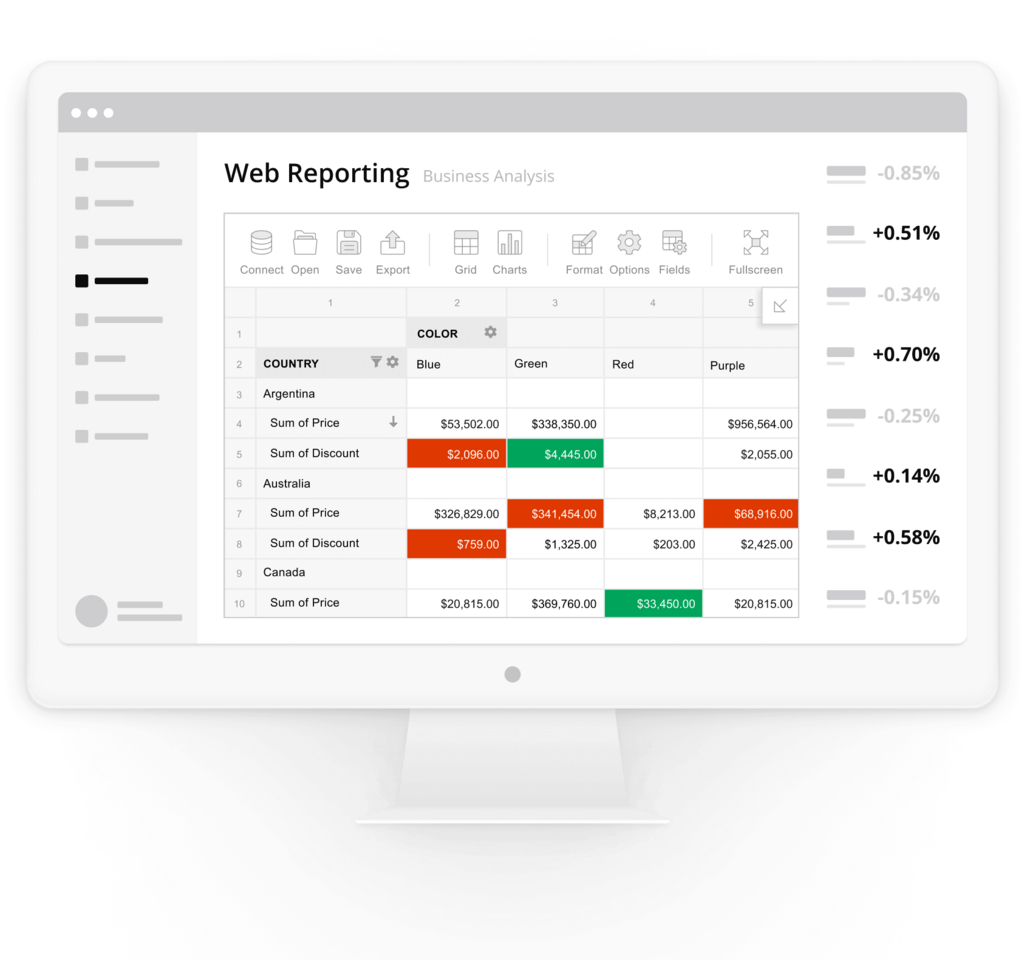
Instead of being locked into one view, Pivot Tables encourage you to explore your data. You can ask new questions and get answers on the fly, leading to better insights and smarter decisions.
What is the primary purpose of an Excel Pivot Table?
You have sales data and want to see total sales for each product listed down the left side of your report. You should drag the 'Product' field into which area of the Pivot Table control panel?
Now that you understand the what and the why, you're ready to start building one.